Crafting unique Ph.D. thesis covers with Python 🎨
Exploring quantum device simulations, adaptive sampling, and neural networks to create beautiful thesis covers
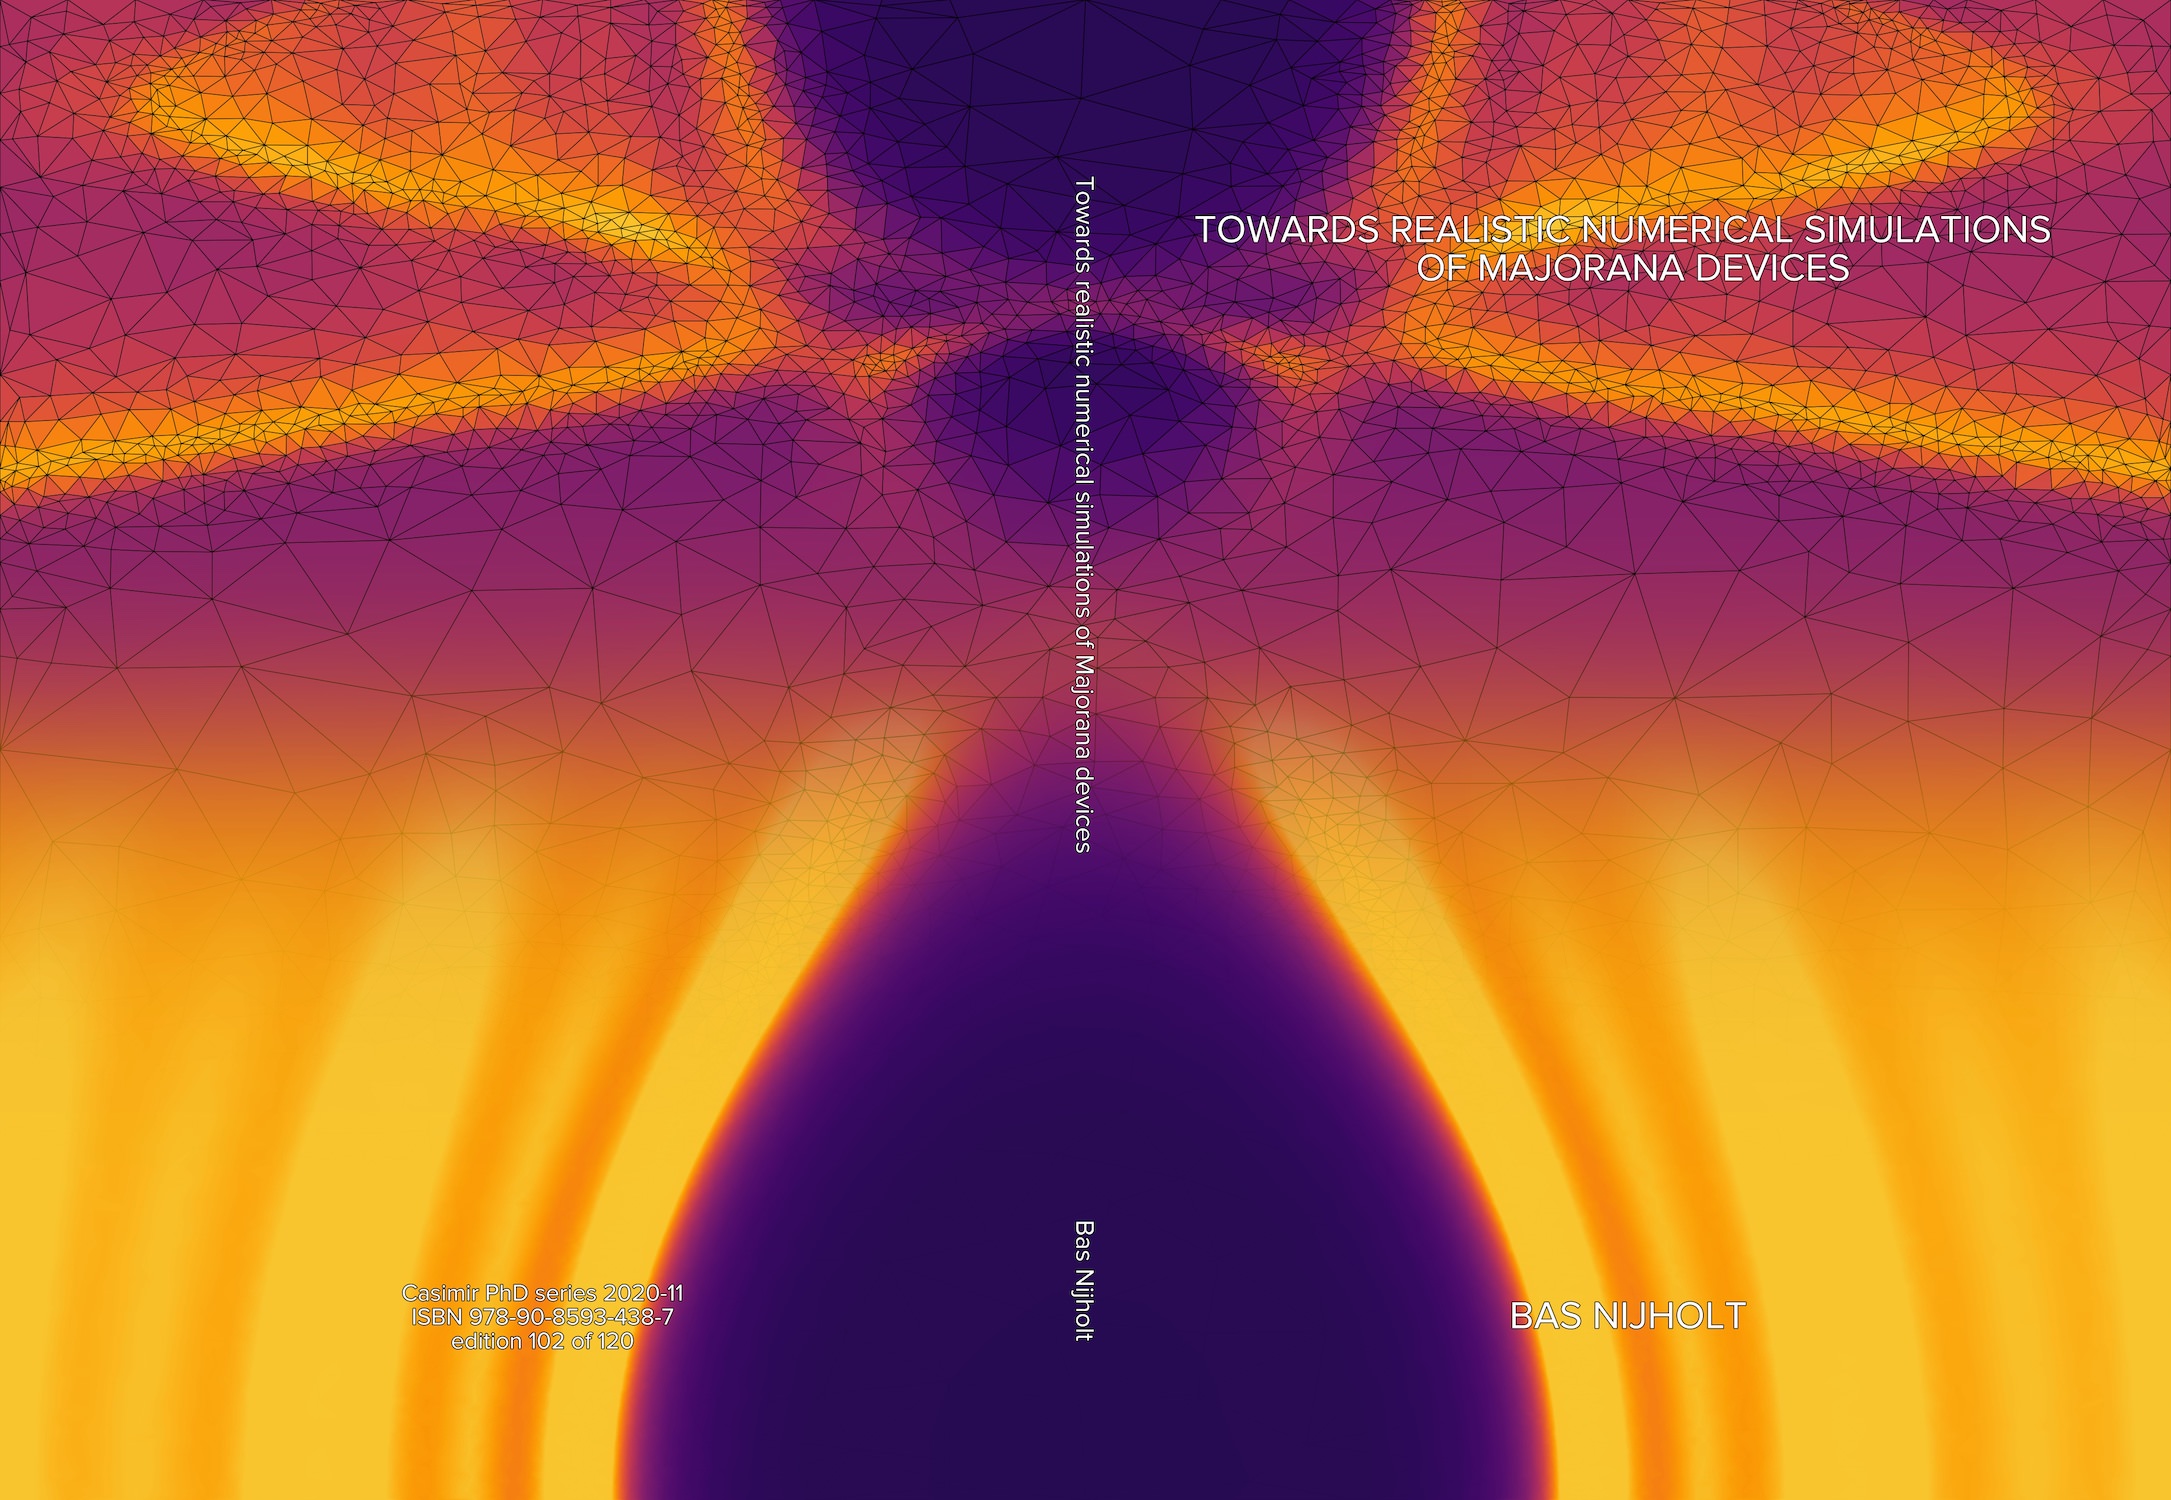
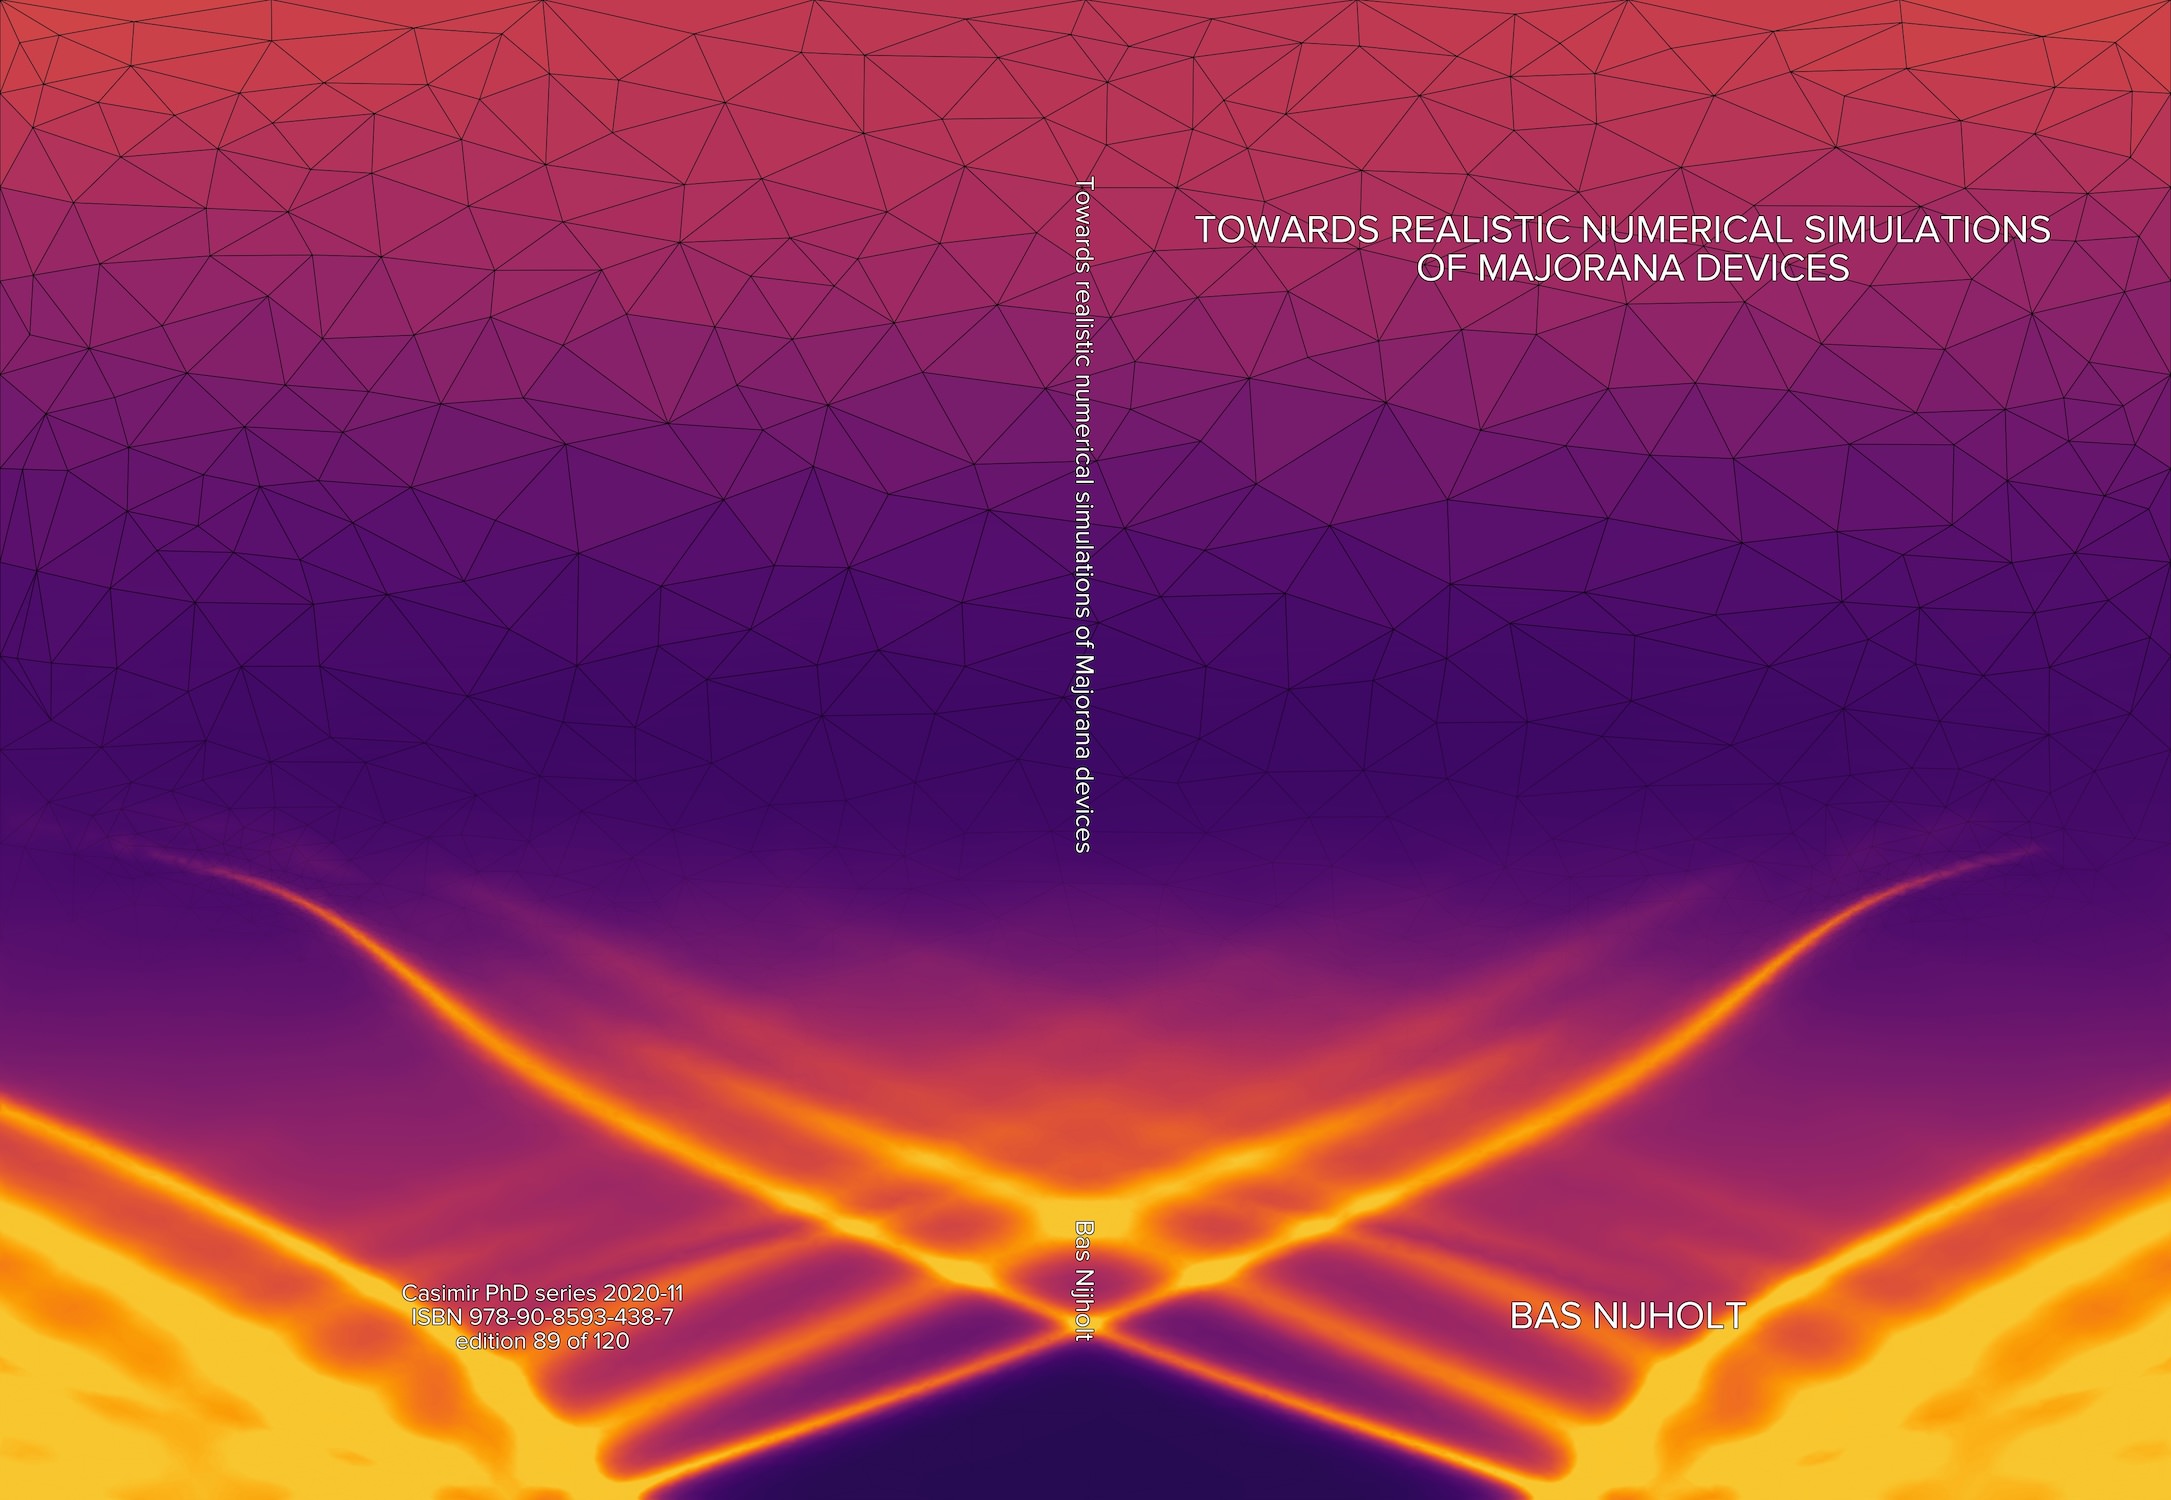
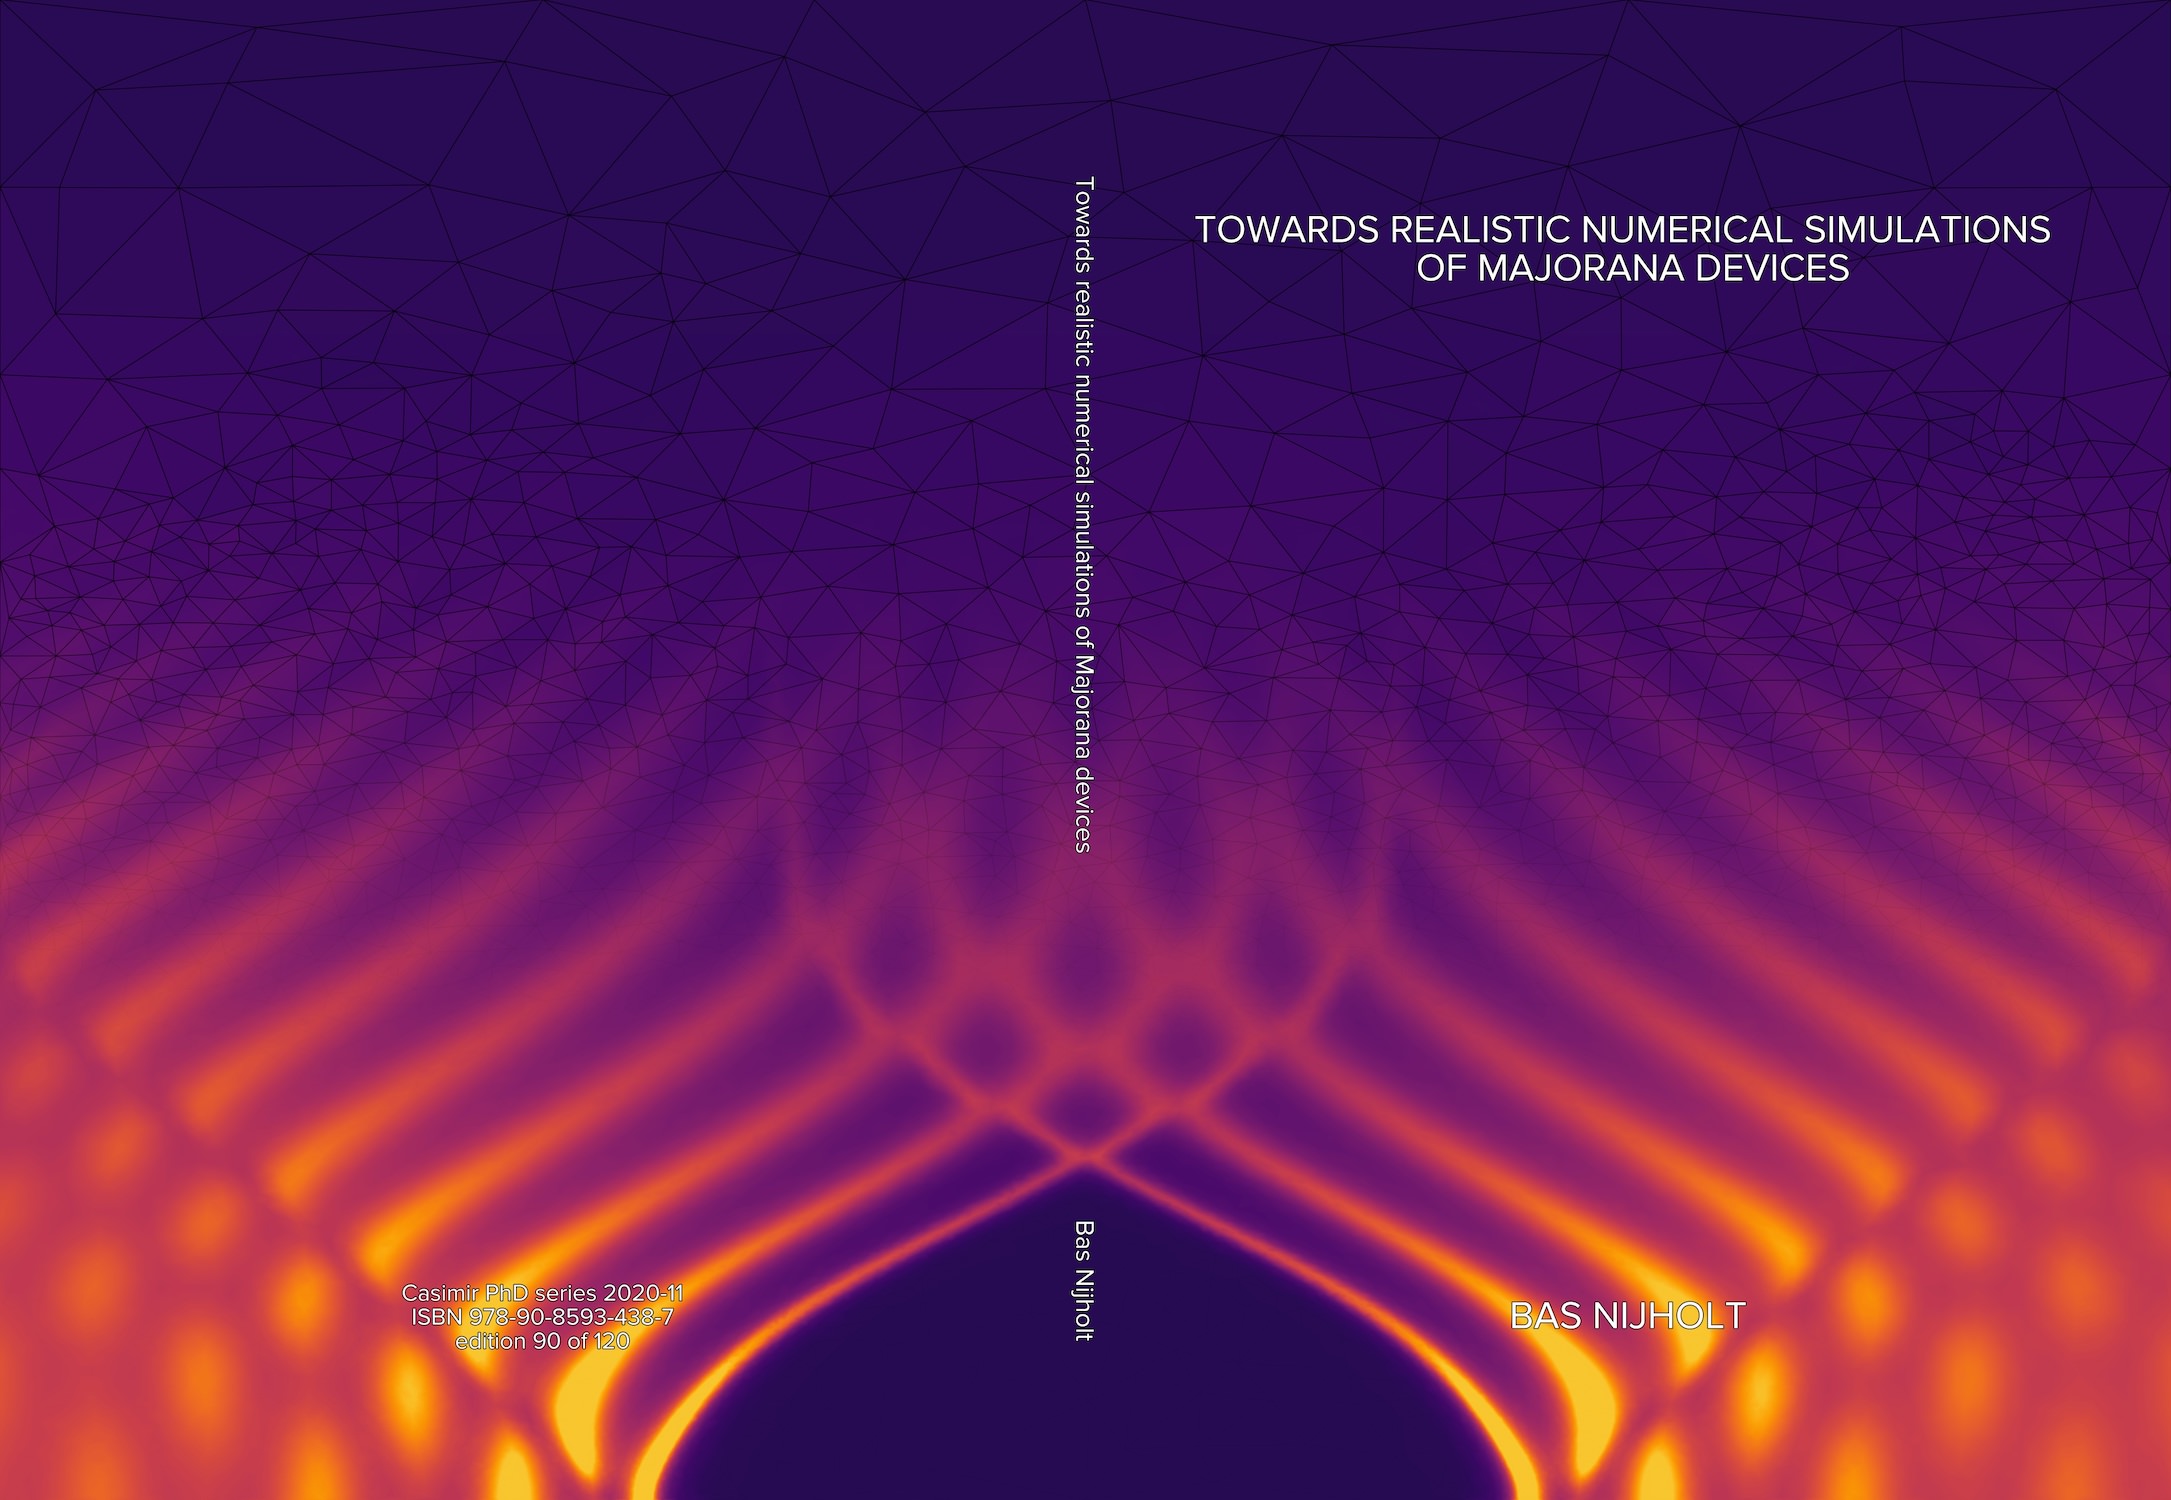
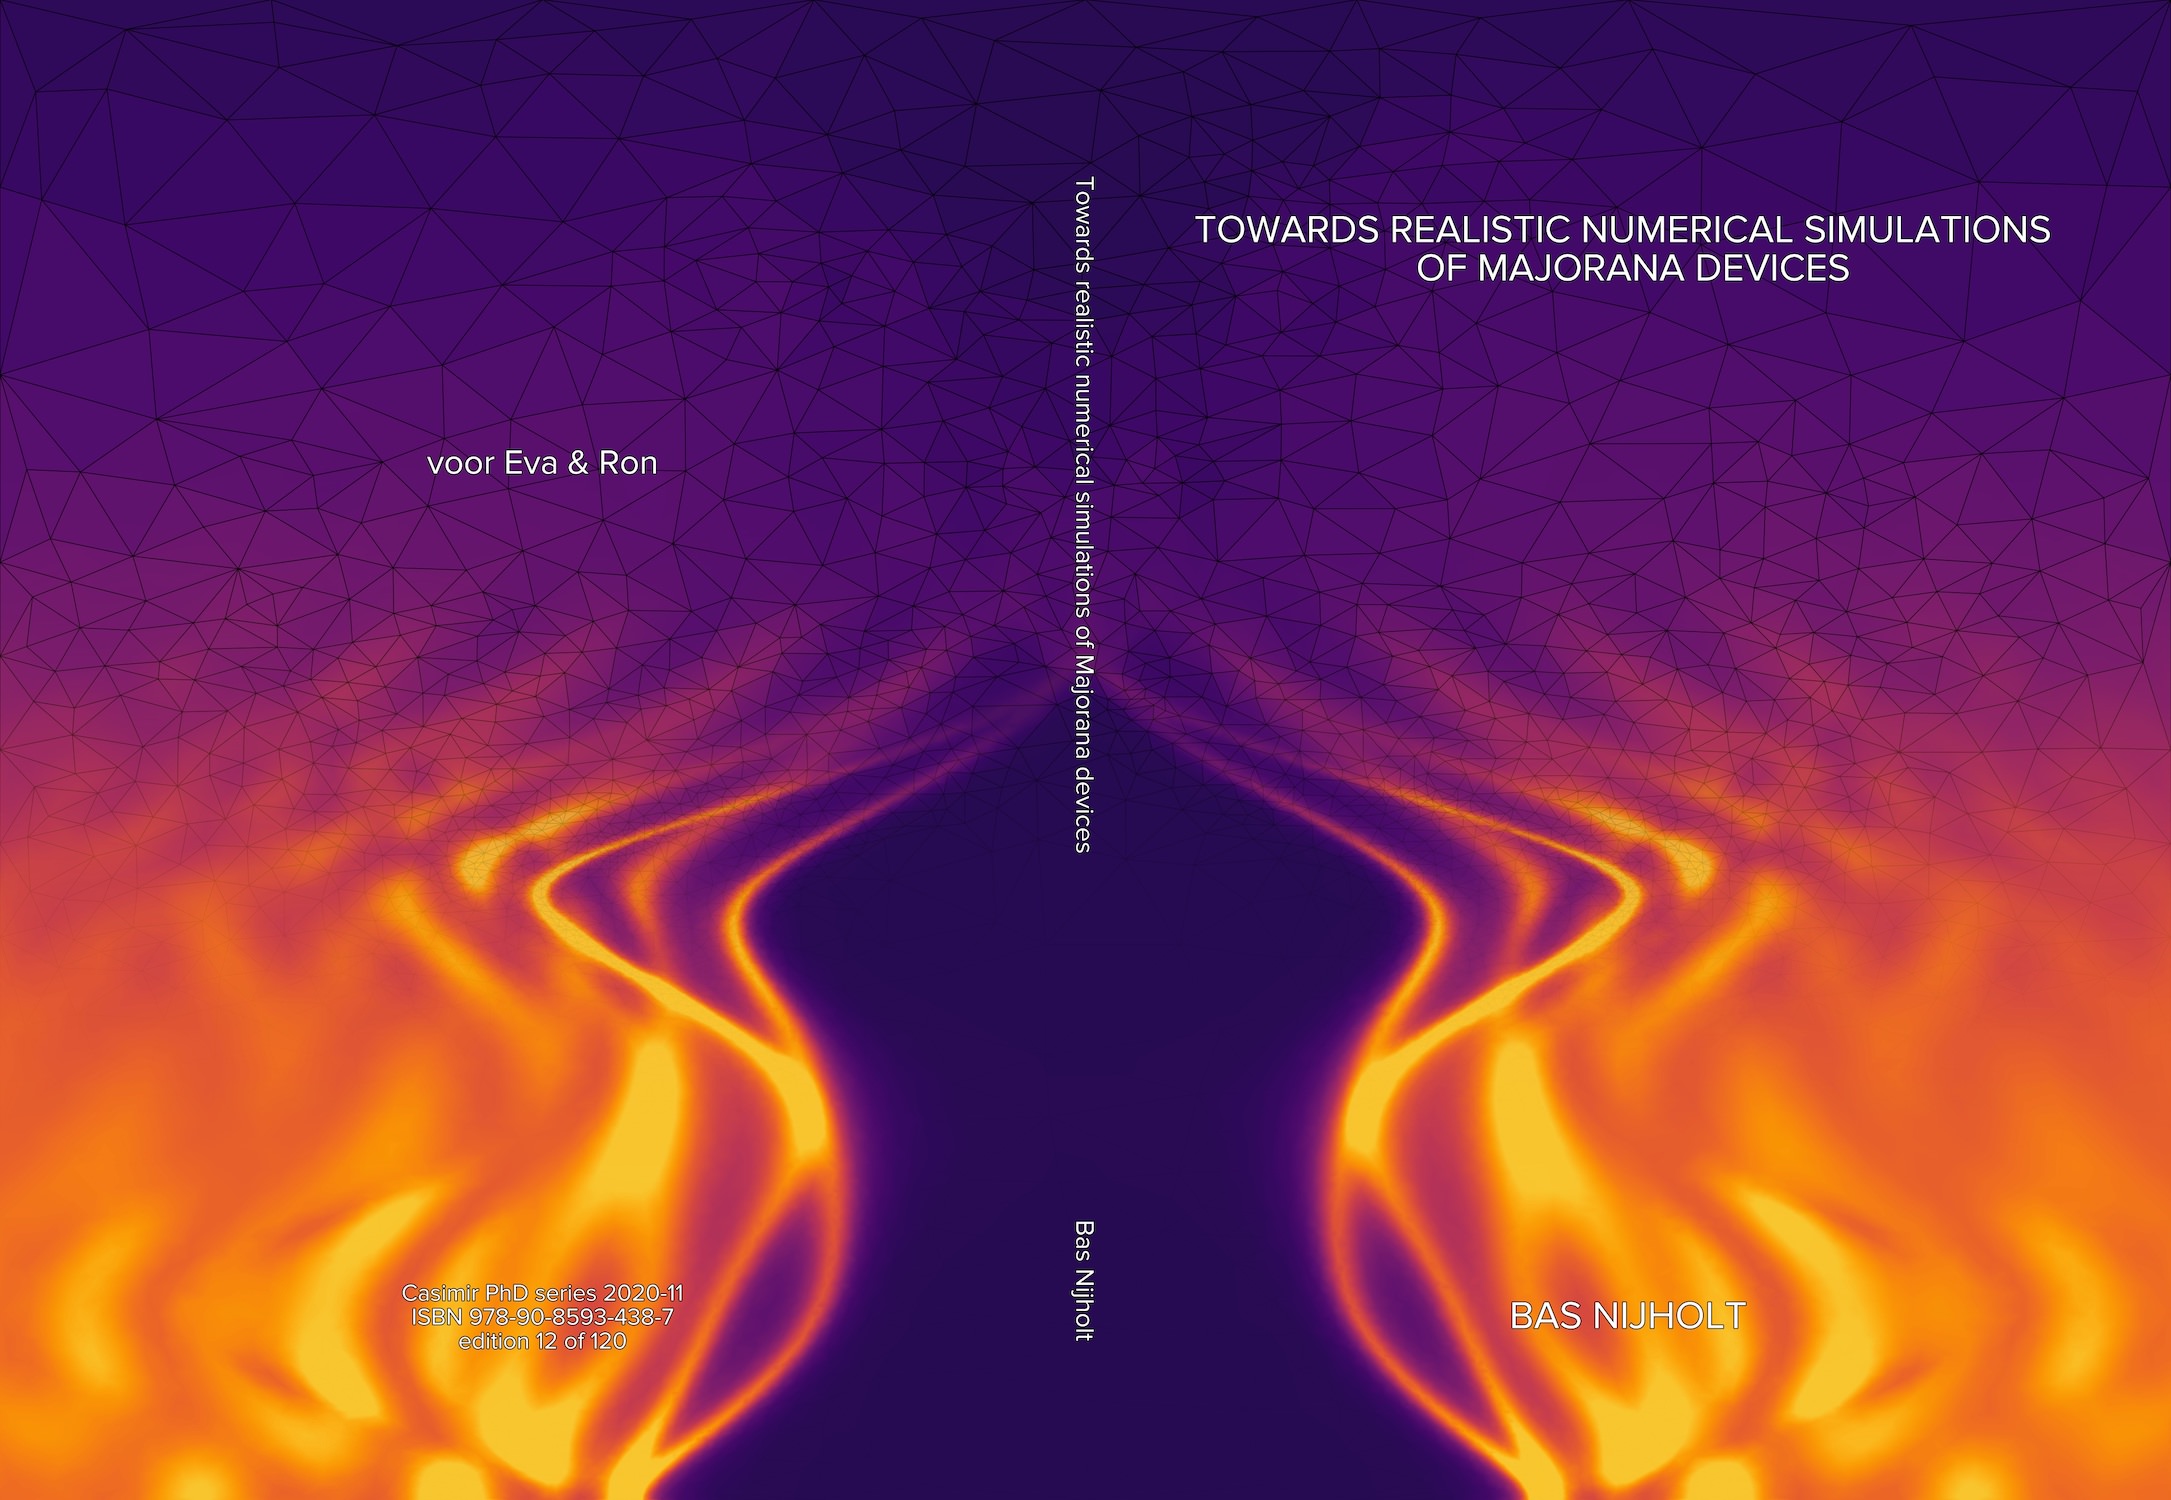
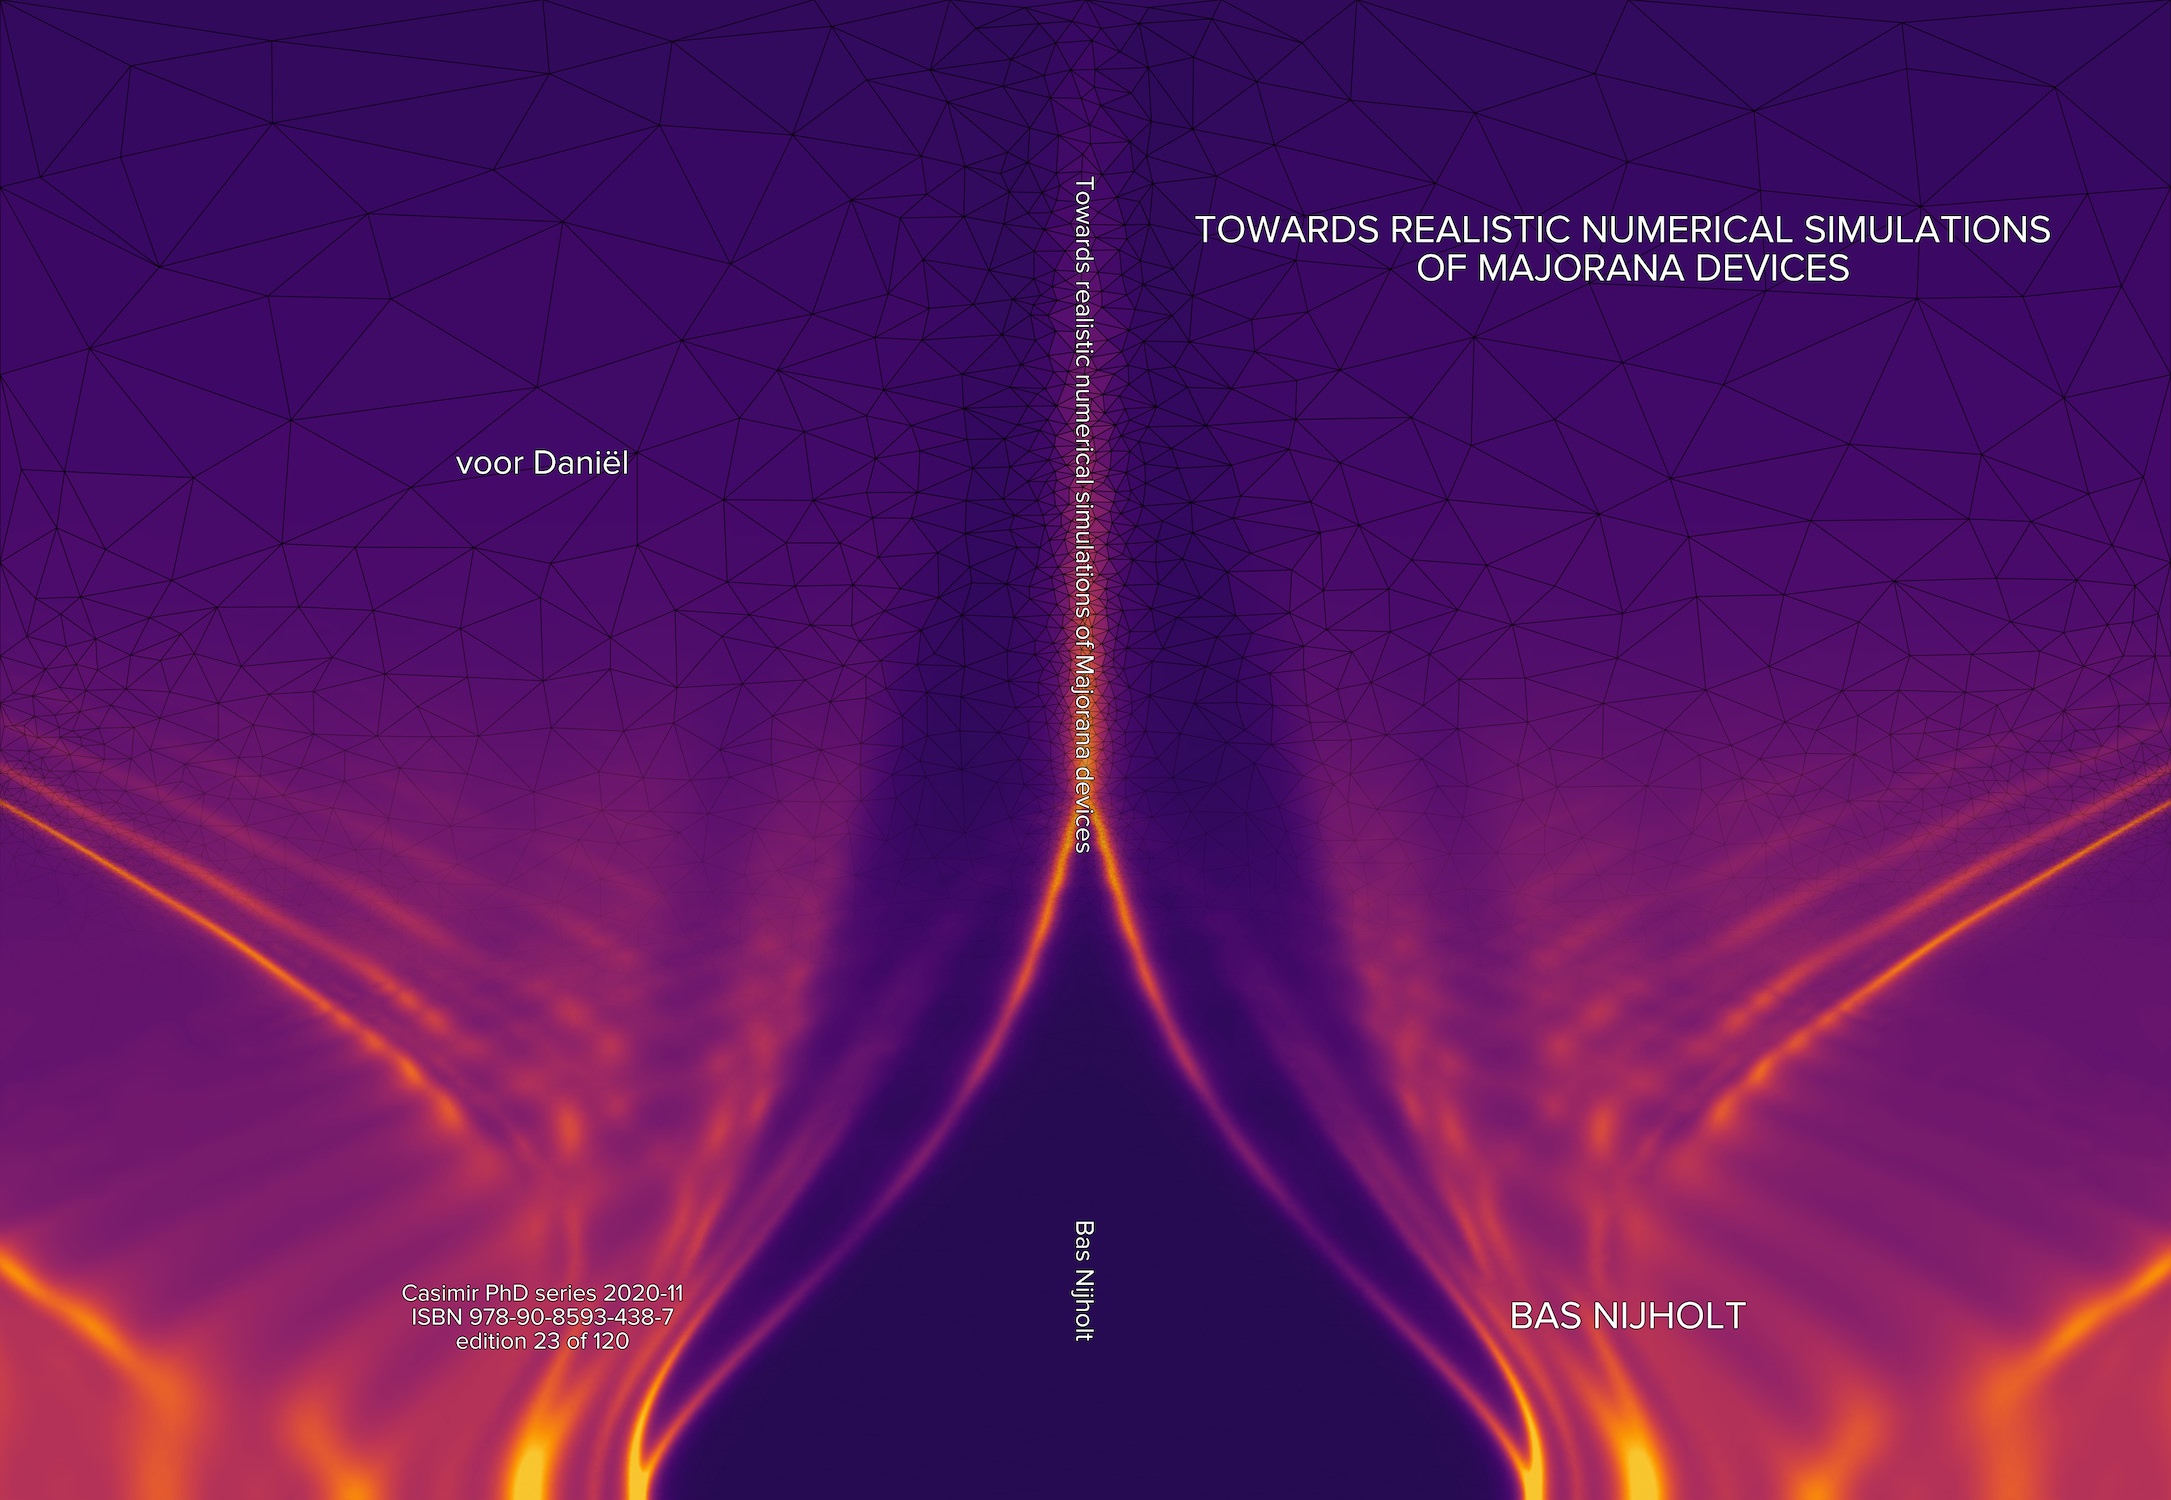
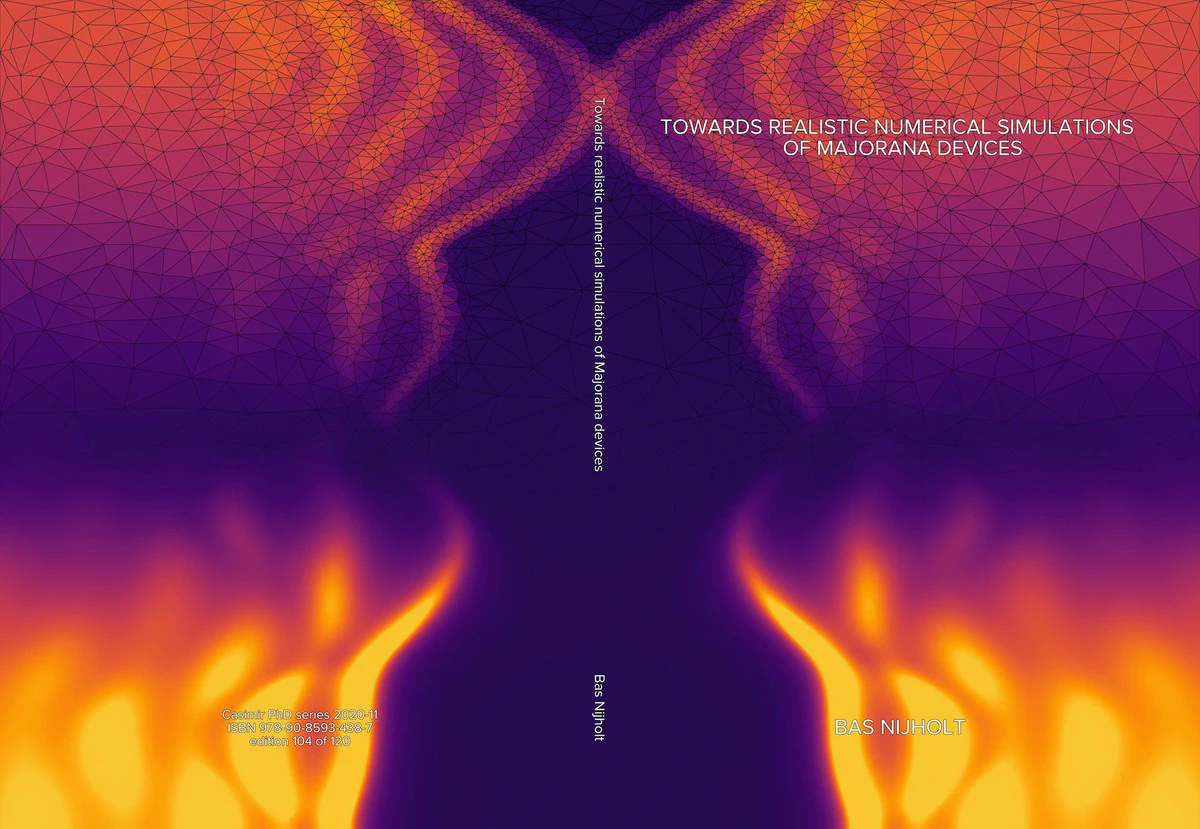 One of the covers I generated
Originally posted on quantumtinkerer.tudelft.nl/blog/thesis-cover on 2020-04-04 13:40.
I will hand out around a hundred copies of my thesis to my defense committee, colleagues, and my family and friends. Let’s be honest, most people will probably not get further than attempting to read the summary and appreciating the cover. Four years of work has gone into generating the content of the thesis, so I figured, at least some thought has to go into the design of its cover. Unfortunately, I am by no means an expert on a graphical design or even competent enough to attempt to use any kind of graphic design software. But luckily for me, I do consider myself an expert in Python , and why not make the thesis design a fun process?
Initial Design: Adaptive Sampling and Data Visualization #
My vague plan was to somehow incorporate a plot resulting from a simulation run with Adaptive [source ], the software I wrote during my Ph.D. to adaptively sample functions in parallel and my proudest work. I even had a potential simulation result in mind that I would use for it, specifically, one that has been on the background of my good friend’s phone for some years and one that has earned me quite some internet points on Reddit. This plot (below) is one of the results of Chapter 4 of my thesis [source ] and this paper.
I went back to the code that generates the plot and started hacking away in Matplotlib. Quickly, I realized that not only the plot above was going to look cool, but that many other data sets that I had also resulted in beautiful patterns. I hit the paradox of choice: I had a total of 3671 unique data sets (all for Majorana devices with either different parameter sweeps or different physical effects that were included in the model) and no idea how I was going to make a selection.
This is an early attempt (and rather ugly in hindsight)

I decided to postpone the choice of which data to use and just focus on how to plot the data first. I experimented with different colormaps, fading colormaps that gradually reveal the underlying triangulation better, and more. On a weekend night, after telling a friend I was with about my plans, we (as usually happens) started to program some of the ideas we came up with. We settled on a design where the triangulation would slowly fade from the top to bottom and where each triangle simultaneously transitioned from a solid color (the average of the values at its vertices) to densely interpolated values. See this Jupyter notebook which generated the final version of the cover. After we also chose a nice colormap (by simply creating the cover for each possible colormap,) the following was suggested: “You know what would be even cooler?! To make every cover unique.” Ten minutes later, I had started 3671 jobs on our computational cluster. When the files slowly started to appear on my computer (I have my local files synced with the cluster), we could not have been more excited. There were simply so many cool looking alternatives. Too many to manually select now, to be honest—a problem for later I thought.
Overcoming the Paradox of Choice: Clustering and Neural Networks #
Four months later, with the rest of my thesis completely done and about a day left on the deadline to submit my thesis, I found myself facing the selection problem I had successfully ignored for so long. There must be a smarter way to select the covers, I thought. Many of them look roughly similar (and some of them are even quite boring or not ecstatically pleasing), so it does not make sense to scroll through all of them. I could cluster them by similarity and then I would just have to choose the nicely looking clusters while being able to instantly discard many.
Finally, a good application to use neural networks!
I still had the 3671 covers in pdf format in some folder, so using the wonderful GNU Parallel, I converted and rasterized all of them to jpeg with
find . -iname \*pdf -print0 | parallel -0 sips -s format jpeg {} --out {.}.jpg
Then I used a pre-trained convolutional neural network model (VGG16) to extract features in a lower-dimensional representation.
I fed the feature arrays to a K-Means clustering algorithm that sorted them in 80 clusters.
To procrastinate a little more, I created an interactive widget using ipywidgets (see video below) to facilitate the selection process.
These are the clusters that I selected in a grid

The selection process was done using this Jupyter notebook.
Finally, I copied the selected clusters into different folders and used the OS’s file explorer to manually select a few covers from each cluster.
Final Touches: Fine-Tuning Colors and Adding Edition Numbers #
Then I printed an initial version of my thesis, however, I wasn’t really happy with the colors.
To choose the right color scheme I got help from a non-tech savvy friend who went to art school. Due to the COVID-19 crisis, we couldn’t sit side by side, so I created this Binder “app” with sliders.
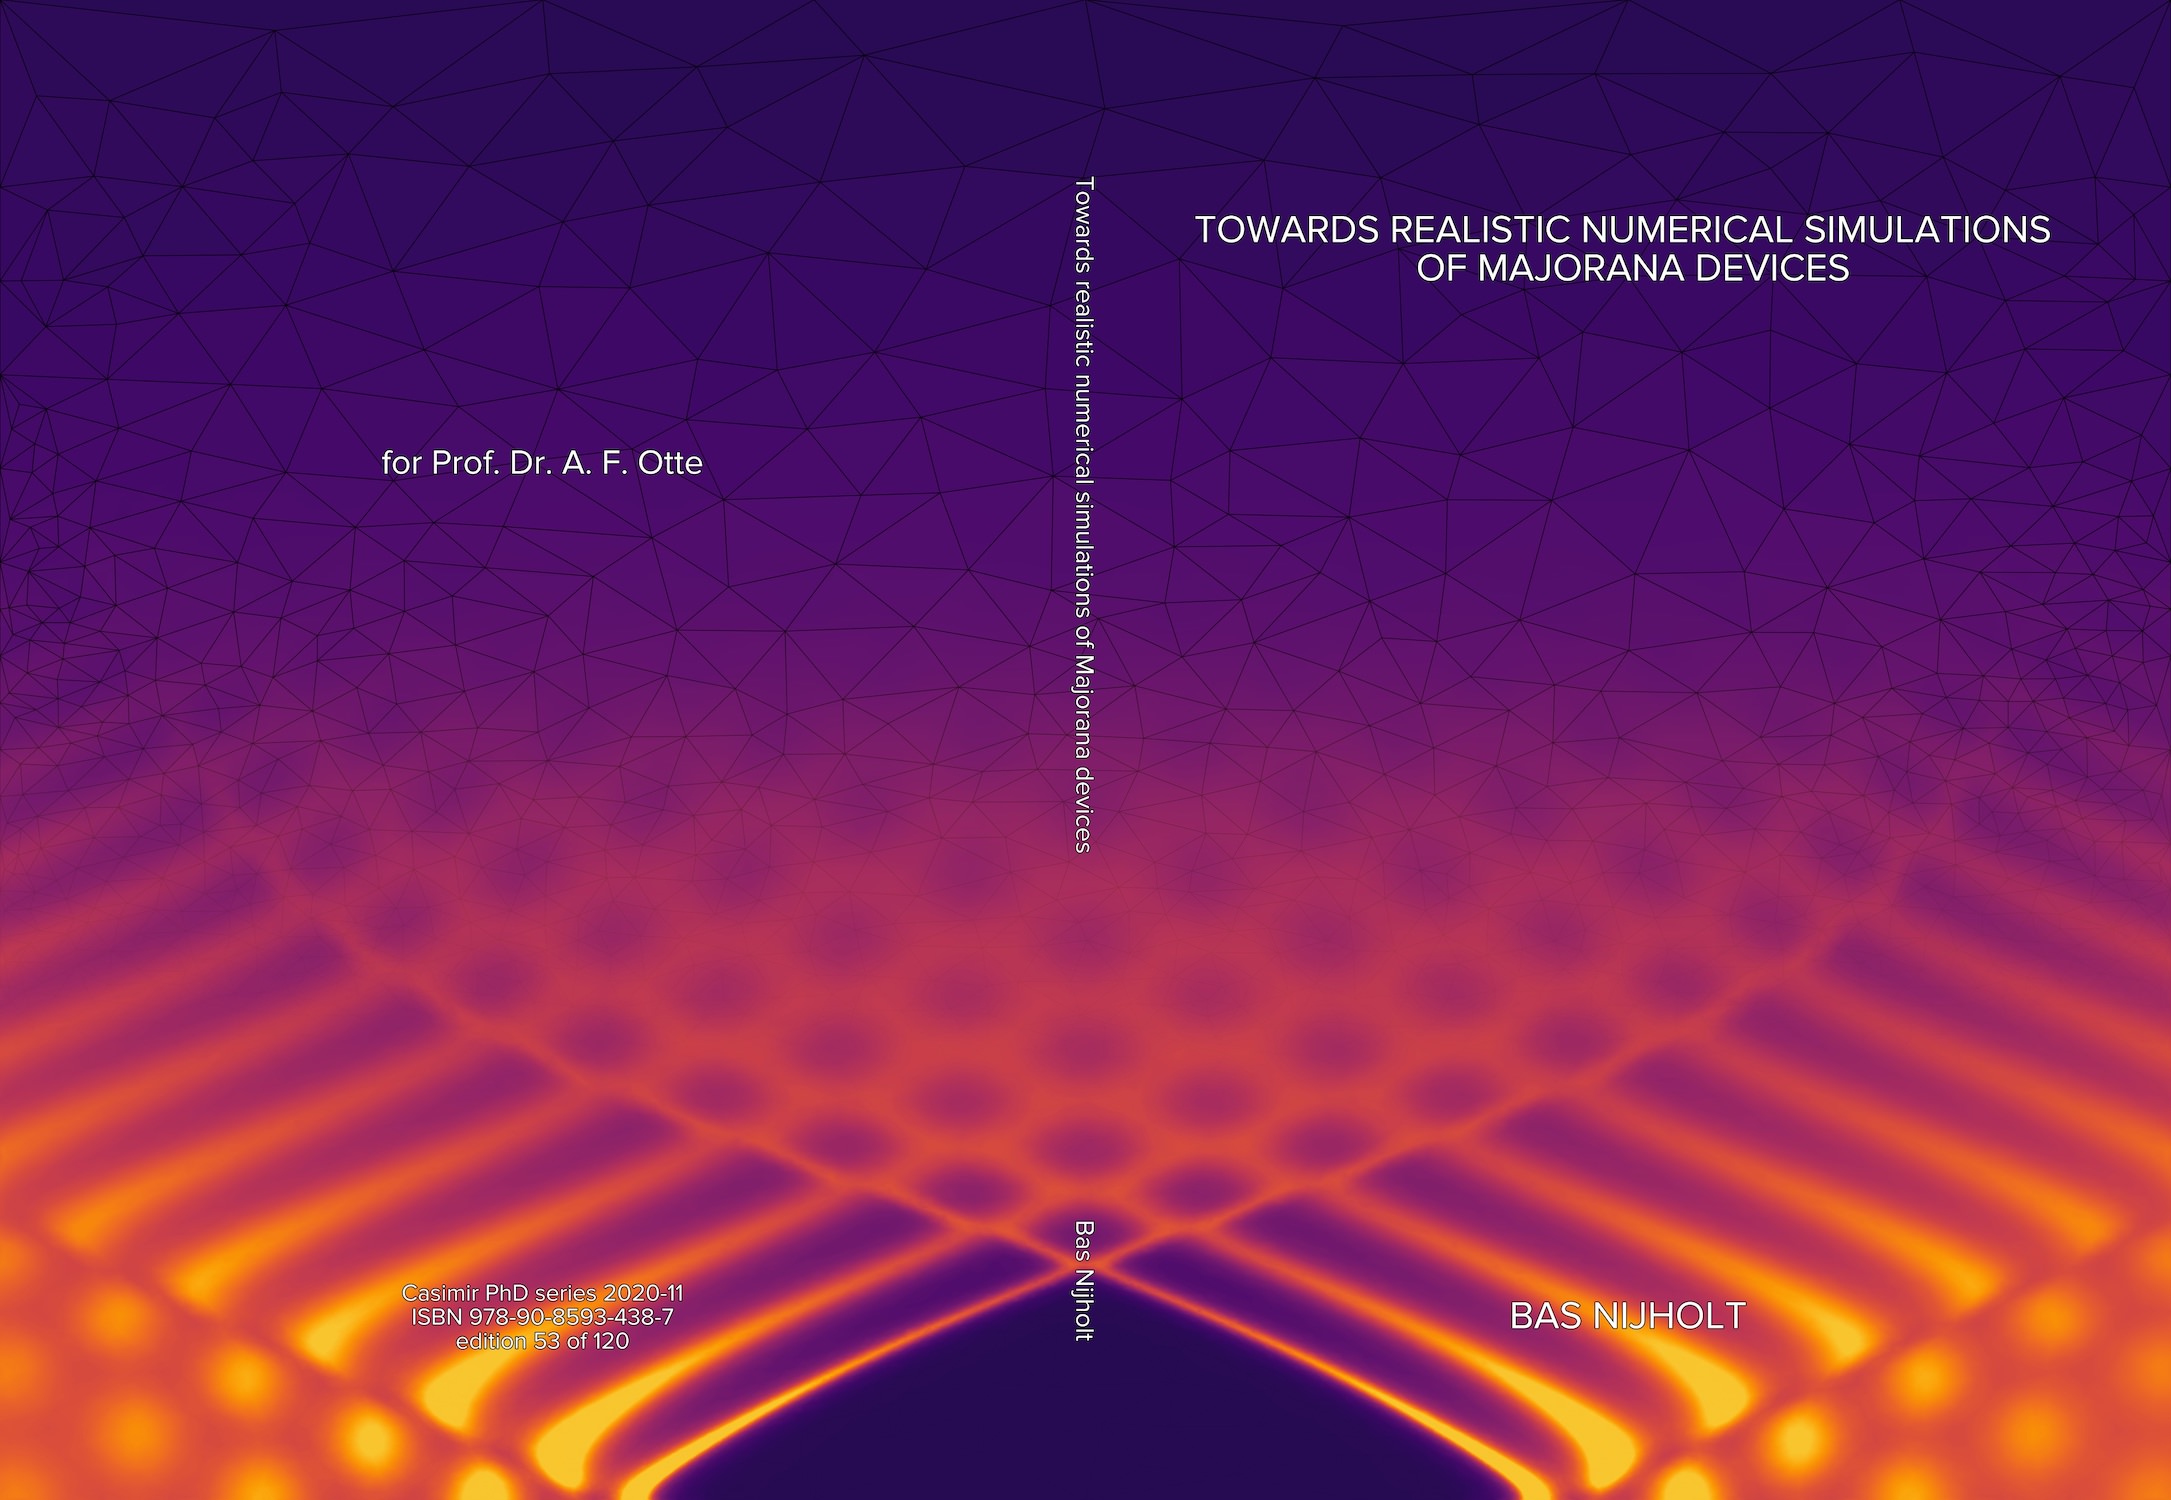
Additionally, since all of them were different anyway, I gave them an identifier and added
edition n of 120
to the back.
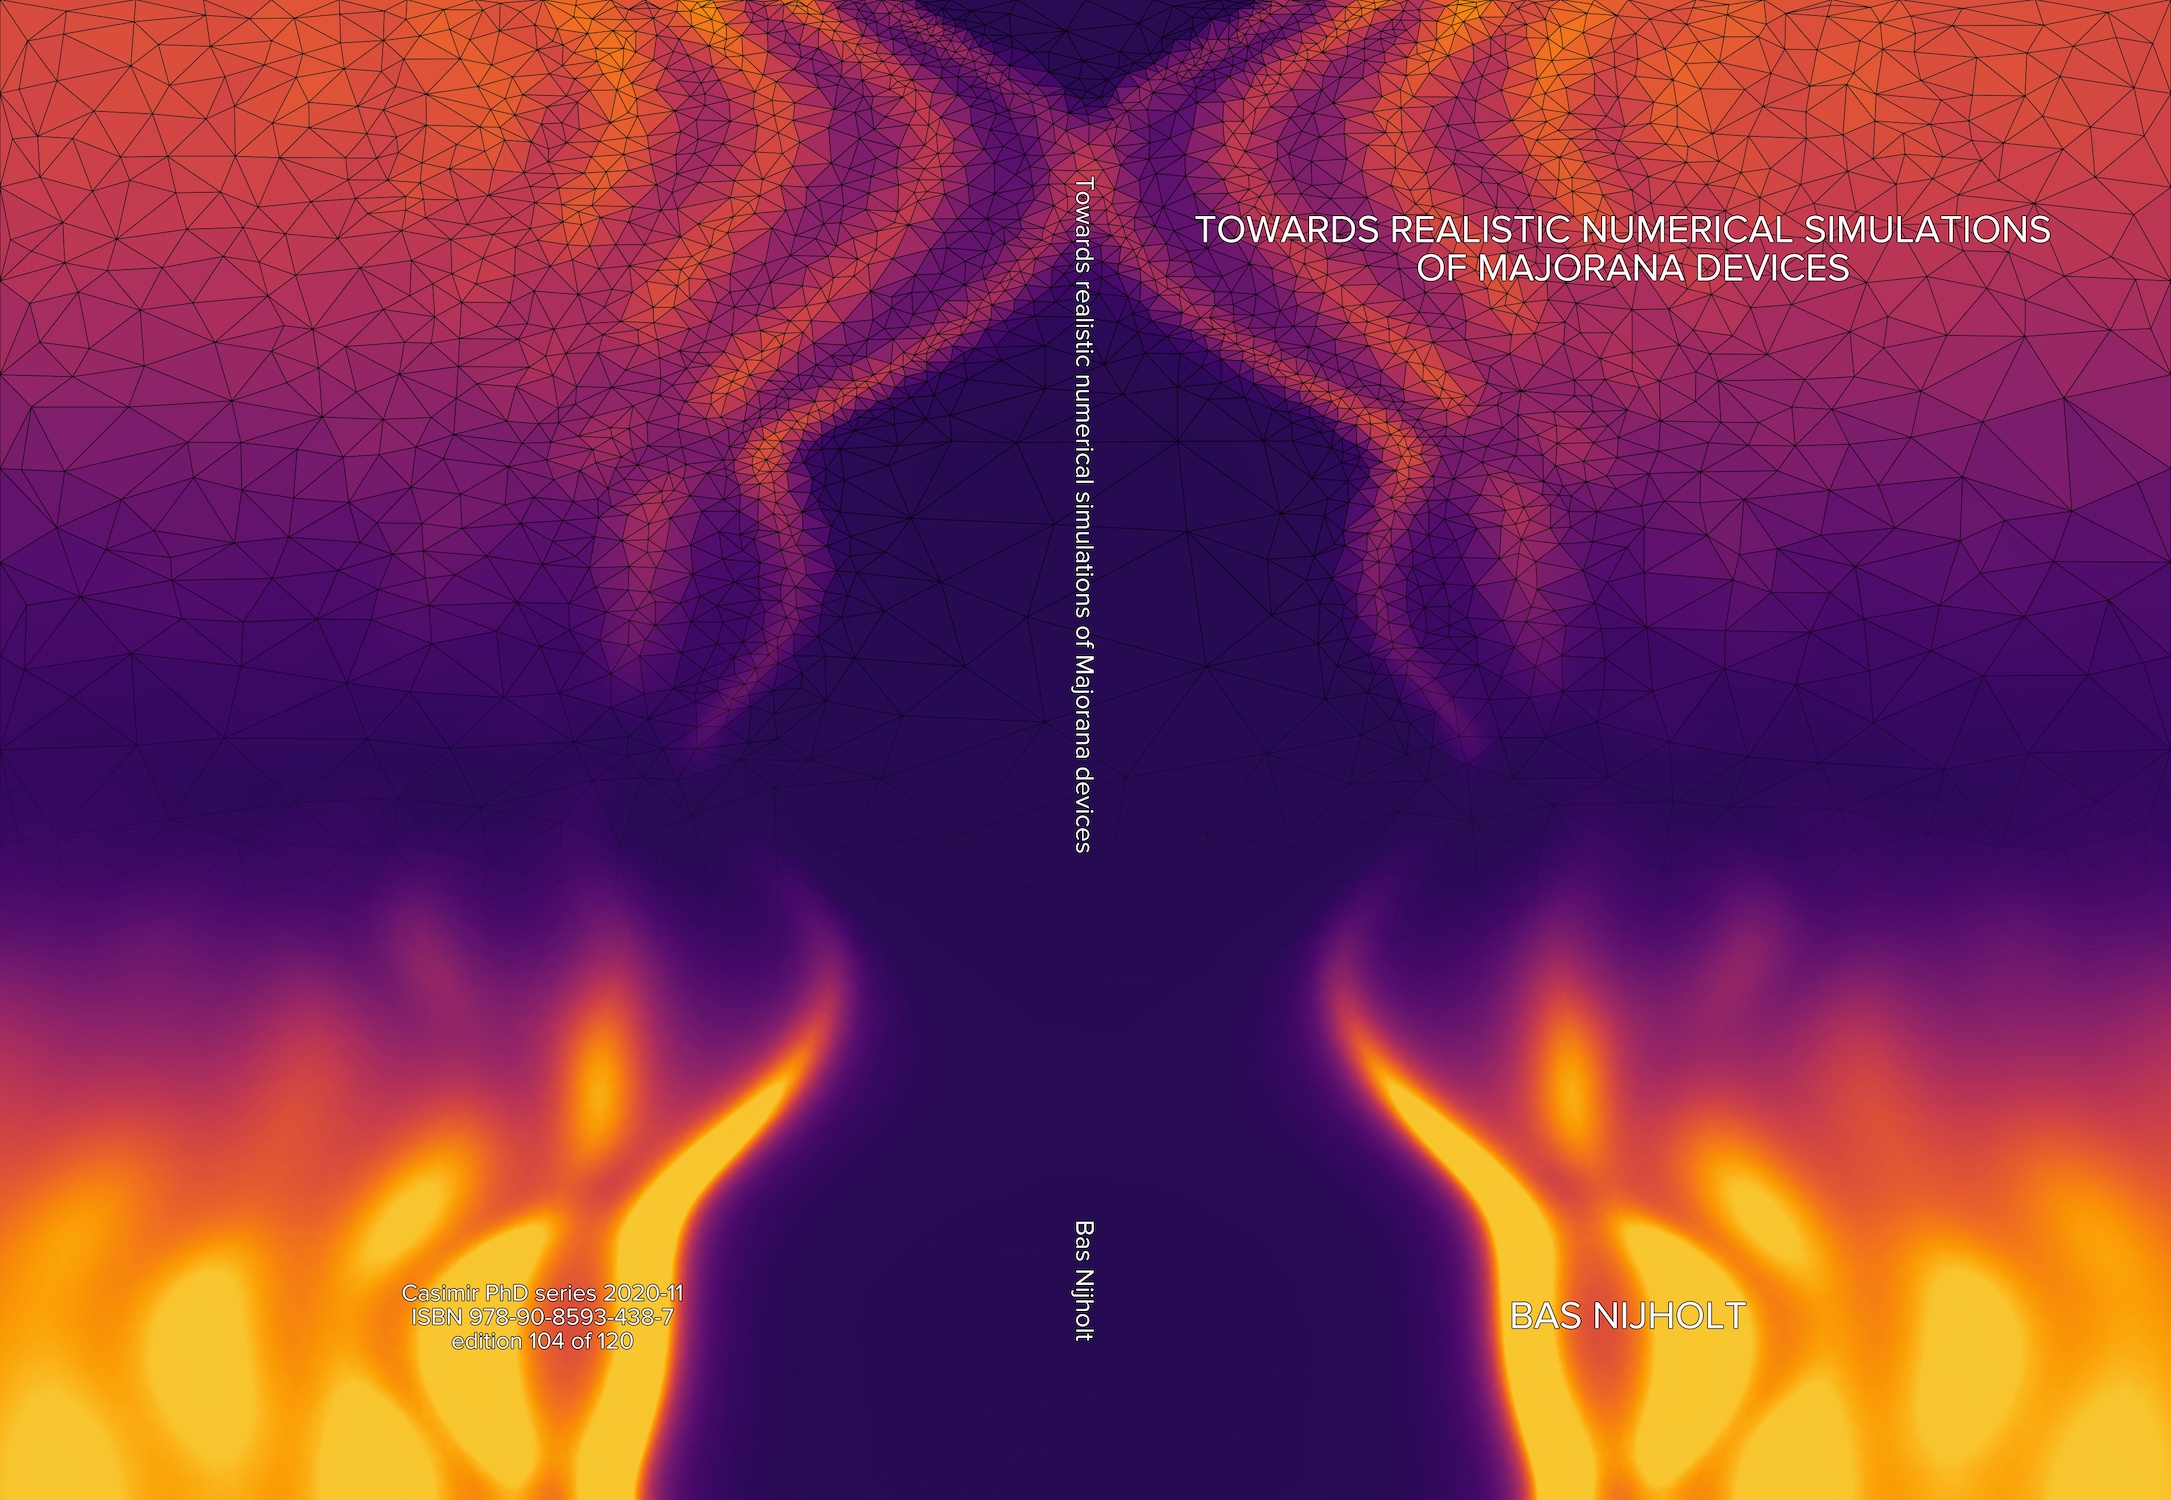
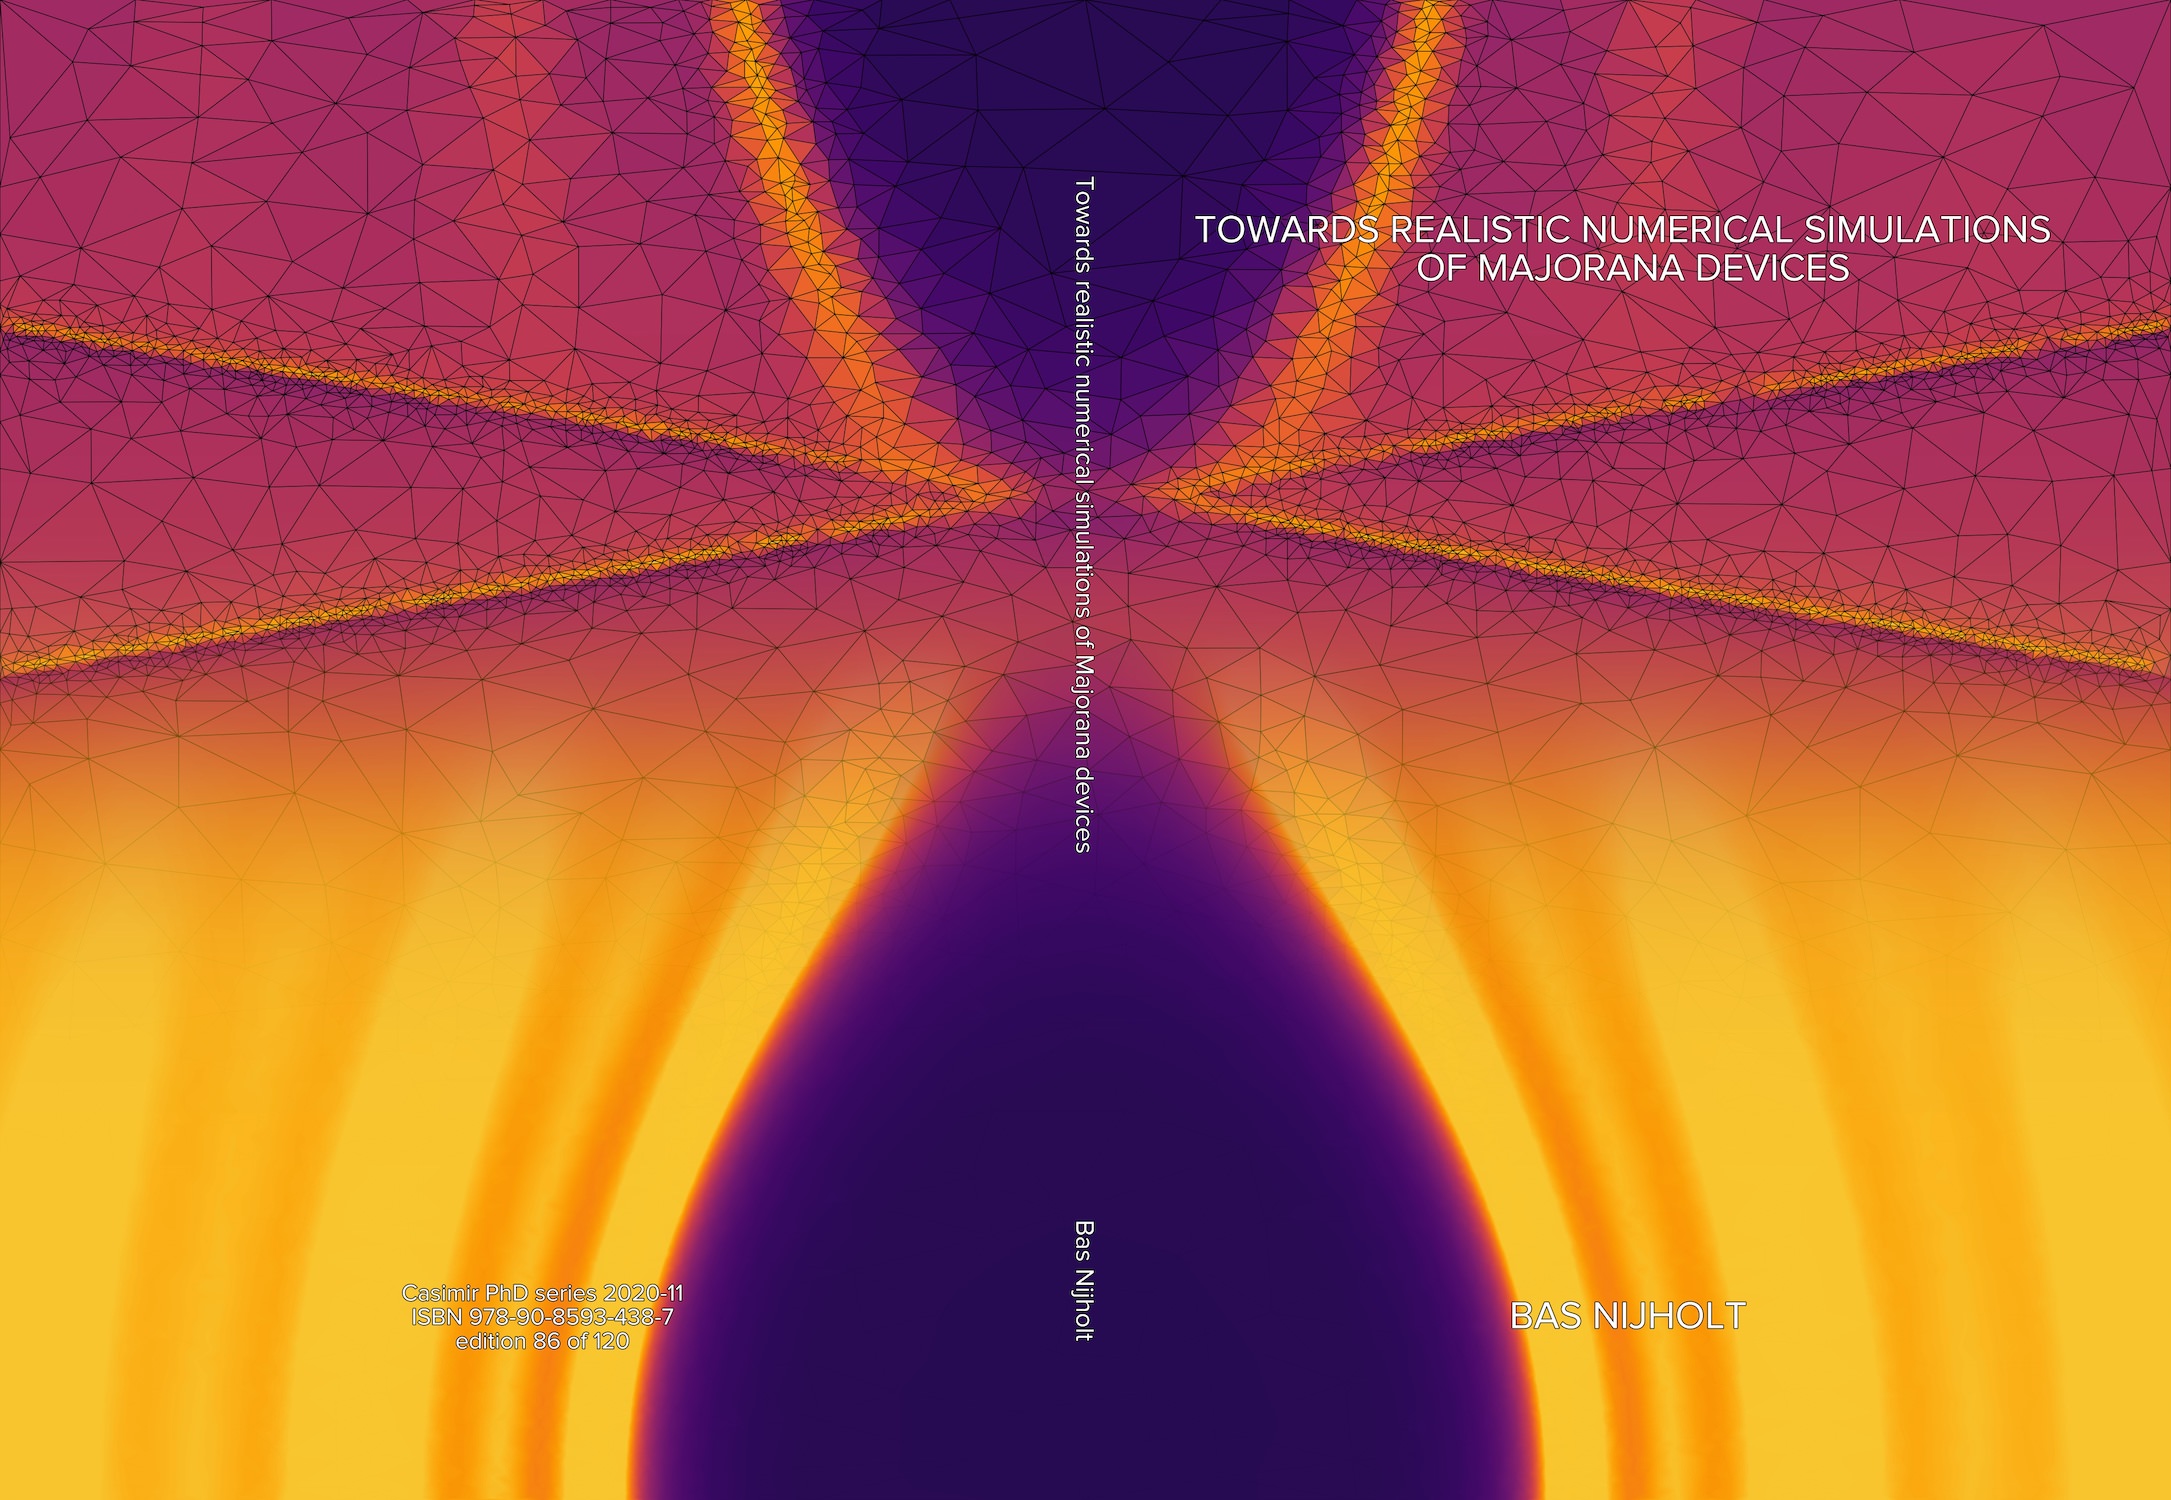
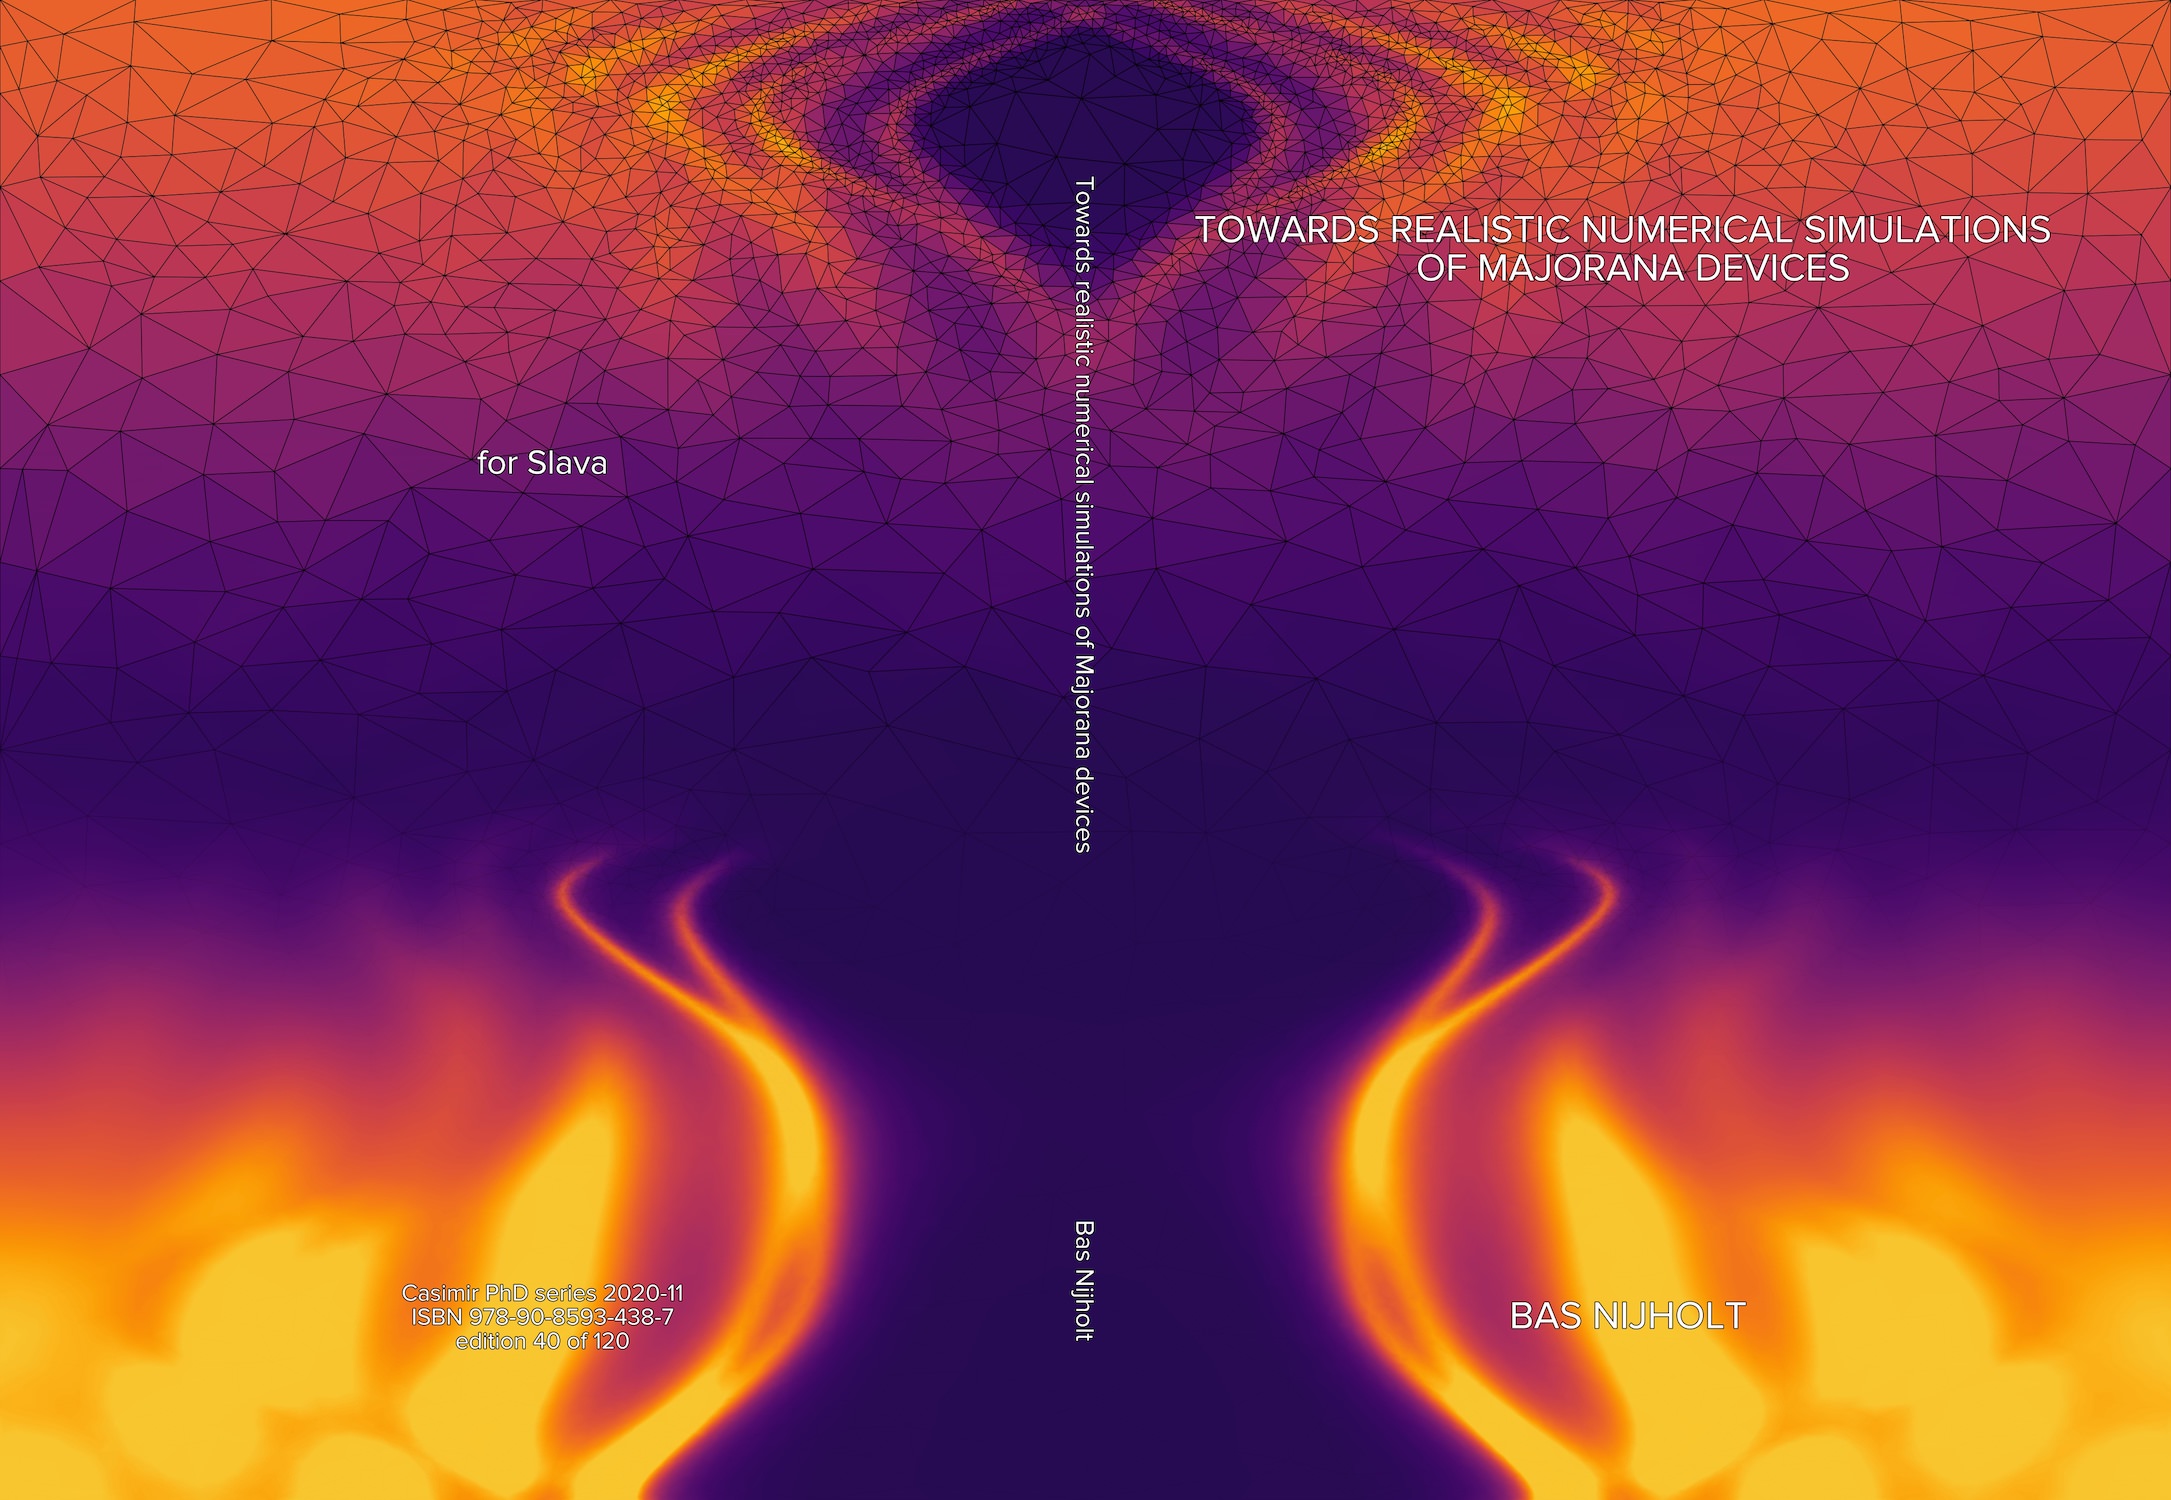
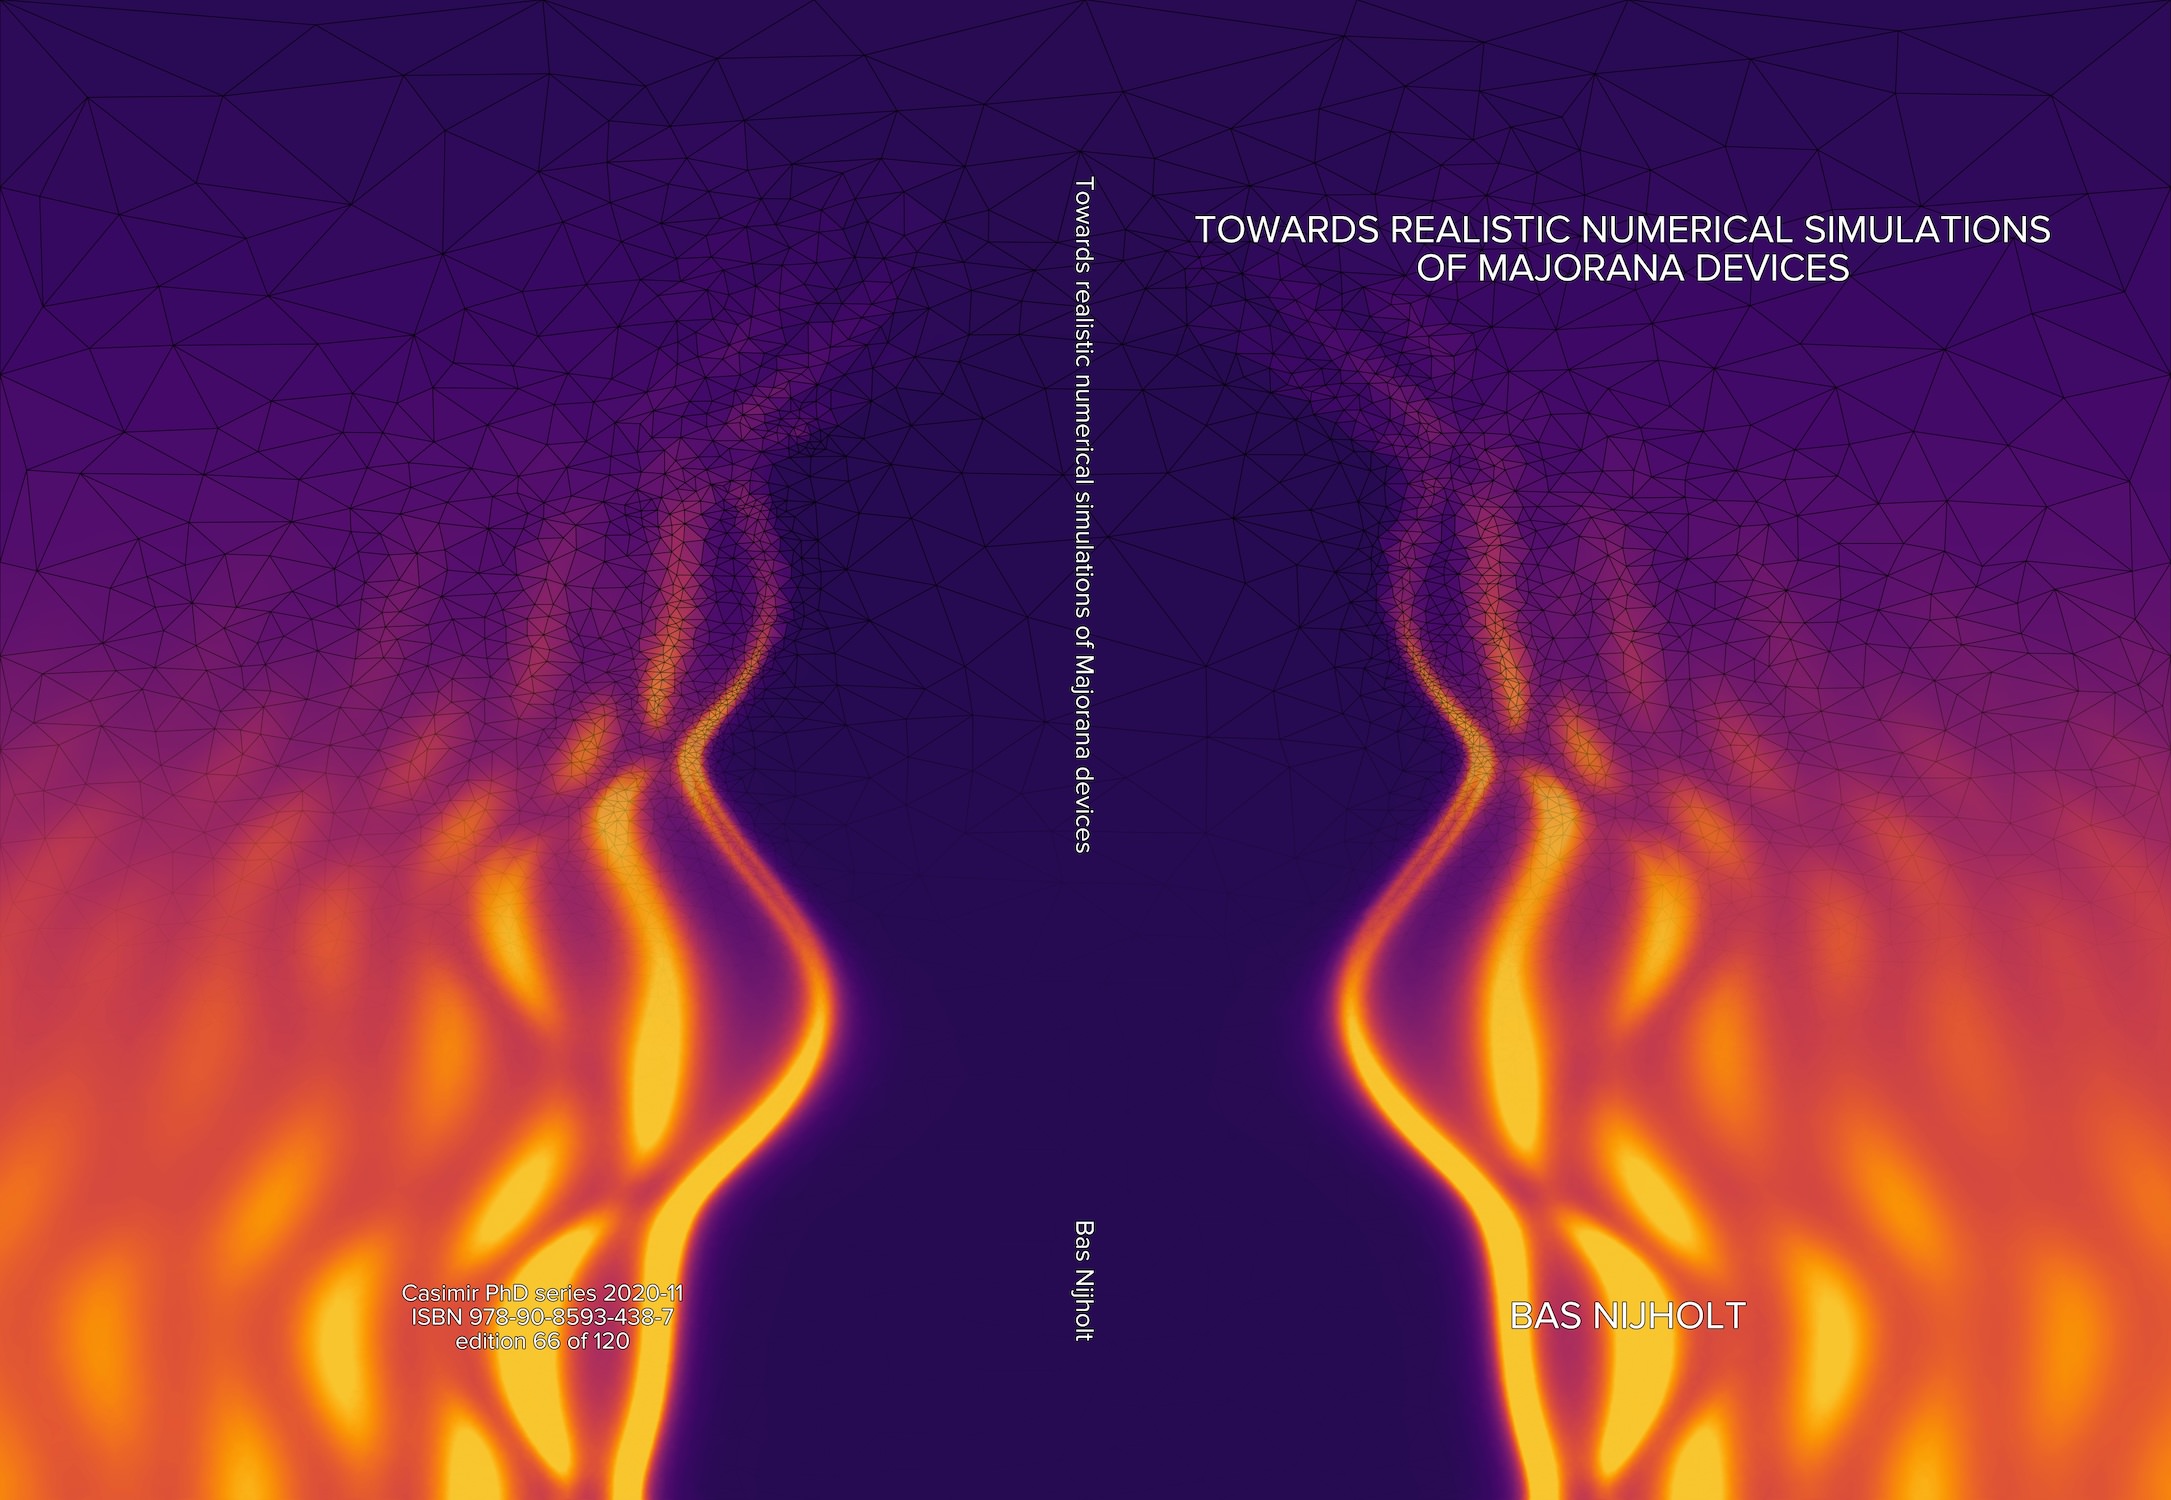
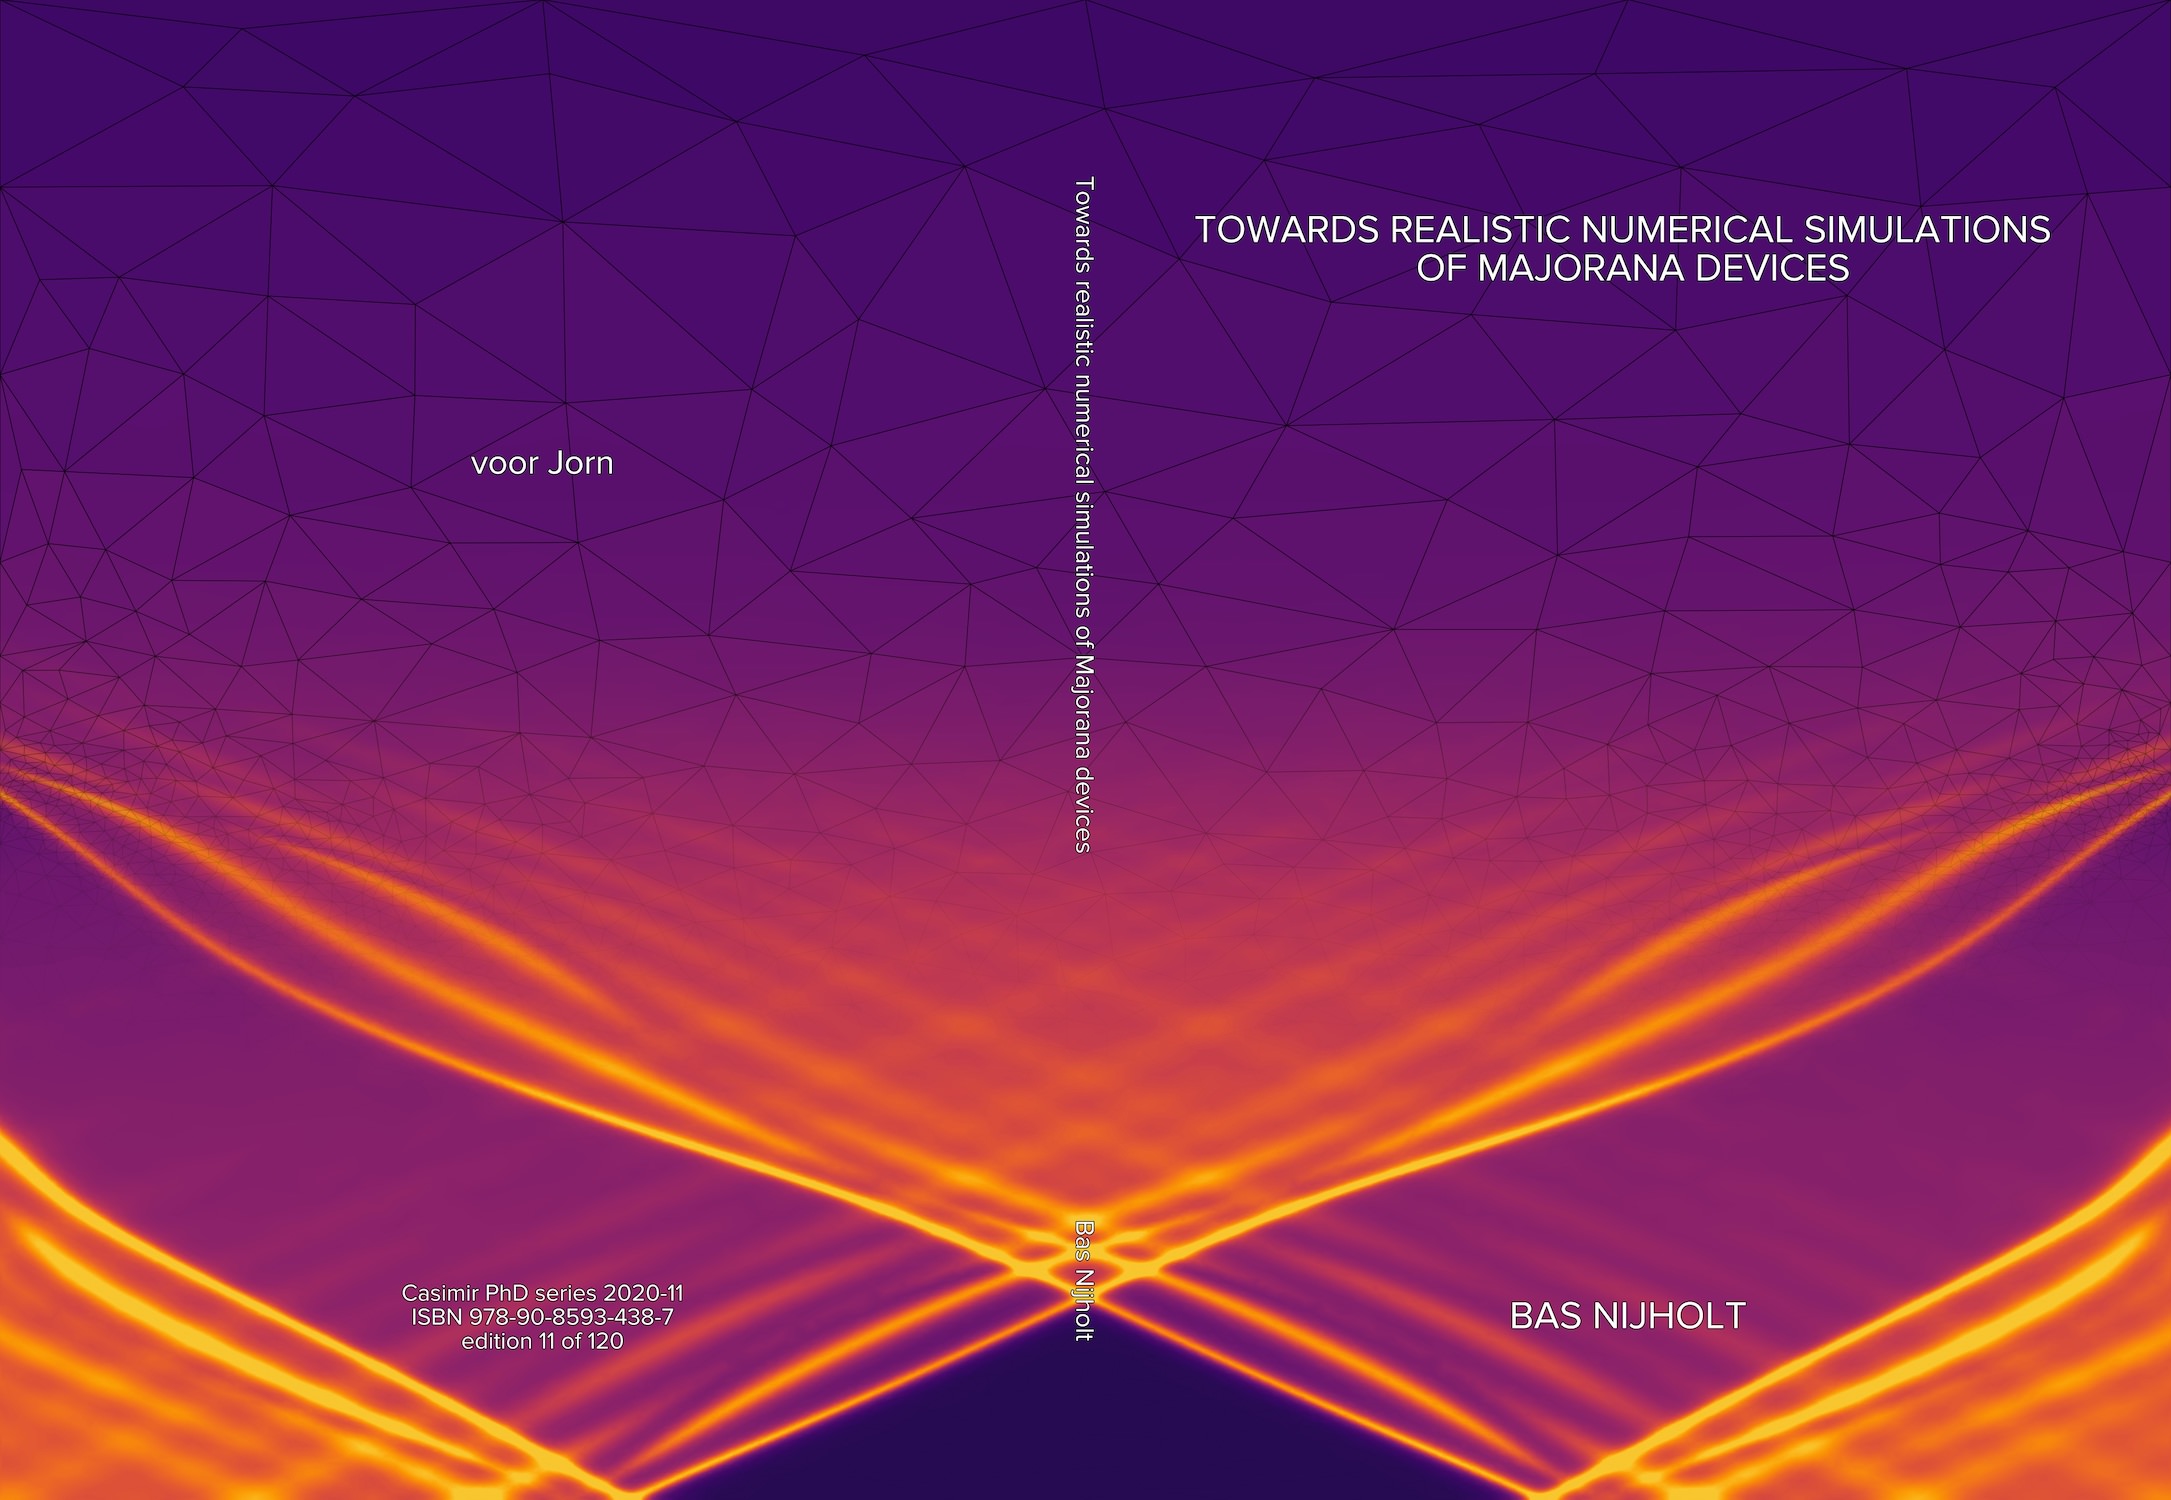
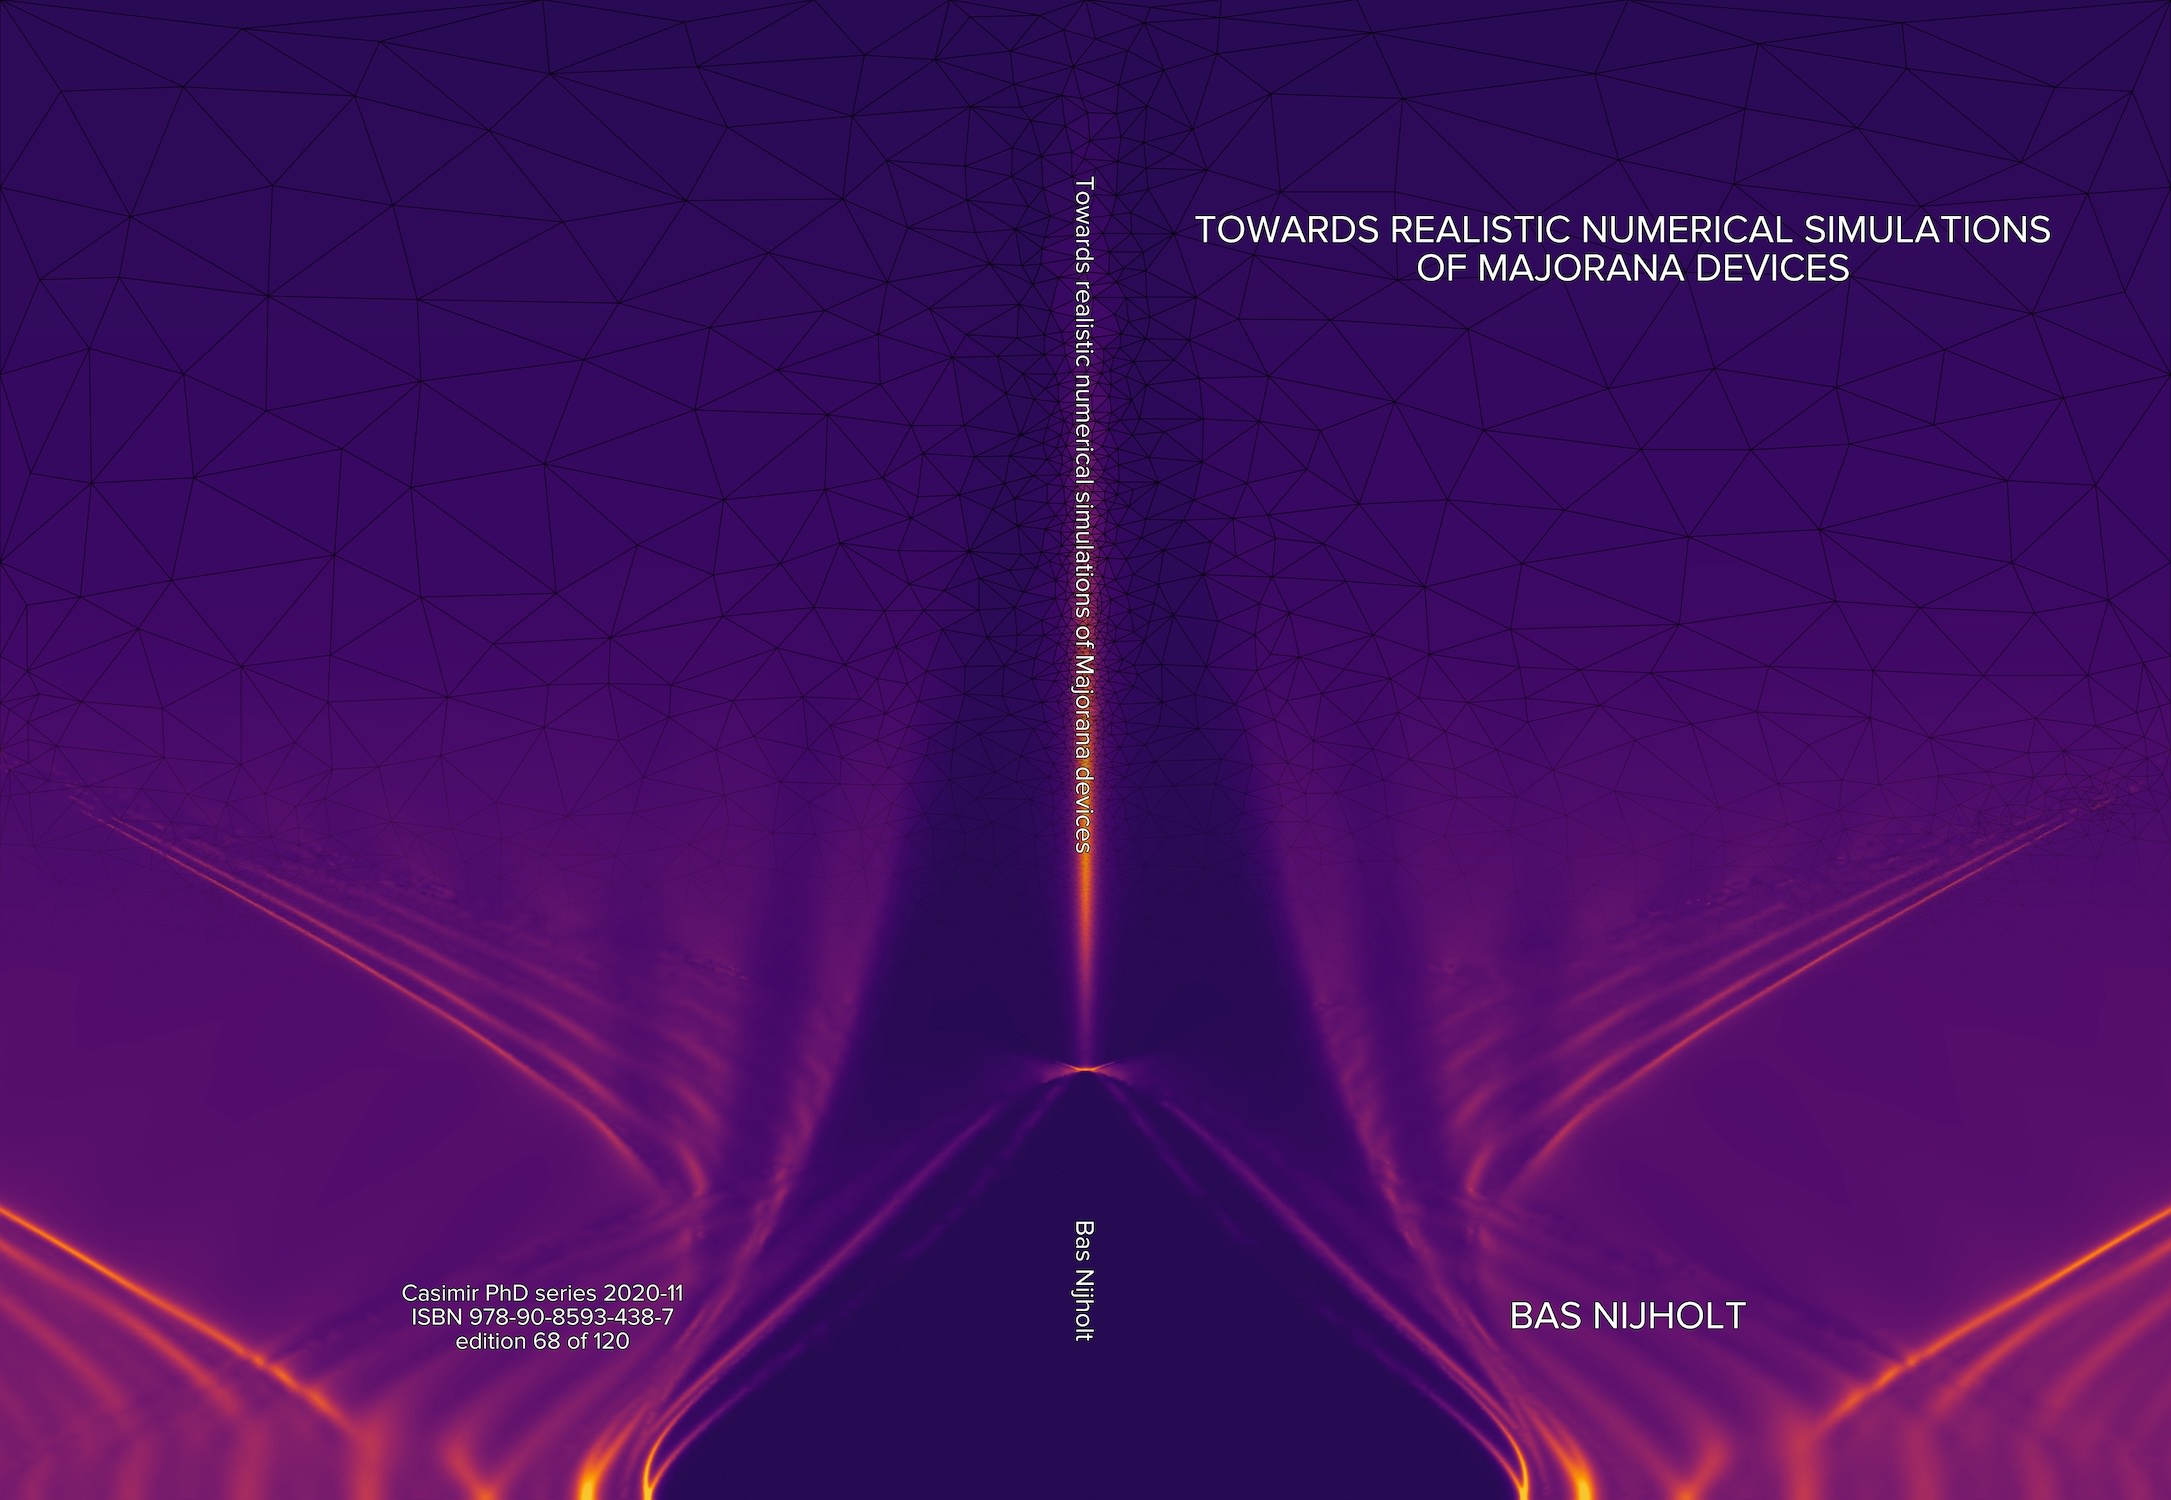
These are a few examples of the final result (click on one of the images to open gallery view)
A few days later, this was delivered to my doorstep


And finally I mailed them to my Ph.D. committee

Now it’s time to start preparing for my defense at May 11, 2020 at 15:00!
Notes #
- The data and code to generate all printed covers is available at basnijholt/thesis-cover
- The simulation code that generates the data is available at basnijholt/spin-orbit-nanowires
- The video of the Reddit post is generated using this code