Matplotlib
1 page · RSS feed
- 📅
calendar-of-life: Plot your life as a grid with one dot per week and one row per year, colored by life stage. Inspired by Kurzgesagt and Tim Urban. ⏳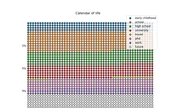
1 page · RSS feed
calendar-of-life: Plot your life as a grid with one dot per week and one row per year, colored by life stage. Inspired by Kurzgesagt and Tim Urban. ⏳