Data-Visualization
5 pages · RSS feed
- 🎄🎁 Advent of Open Source – Day 22/24: Visualizing personal finances with Tiller and Streamlit for better financial independence tracking.
- 🎄🎁 Advent of Open Source – Day 21/24: Creating interactive graph visualizations in Jupyter with AnyWidget and a modernized JavaScript library.
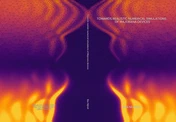
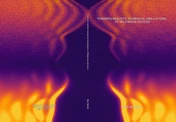
- 🎄🎁 Advent of Open Source – Day 14/24: Combining quantum physics, machine learning, and generative art to create unique PhD thesis covers.
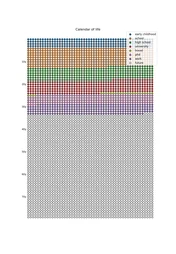
- 🎄🎁 Advent of Open Source – Day 01/24: Visualizing the finite weeks of our lives with a Python project, because who doesn’t need a daily reminder of their mortality?
- Exploring quantum device simulations, adaptive sampling, and neural networks to create beautiful thesis covers